Few factors influence your health and sense of well-being than having clean, fresh air to breathe.
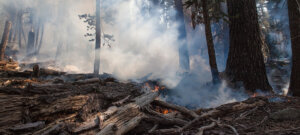
Humans have worried about the effects of air pollution on health since at least the time of Hippocrates. But industrialization and the spread of cars and cigarettes have made good air hard to find — and the growing reach and regularity of wildfires have become the leading cause of worsening air in America in recent times.
Of special concern today is PM2.5 or fine particulate matter: “small droplets of liquid, dry solid fragments, and solid cores with liquid coatings” with a diameter of no more than 2.5 micrometers, which is less than 1/30th of a strand of human hair.
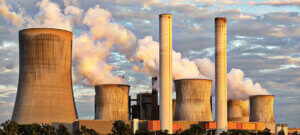
These particles mostly come from burned fuel and firewood. Even one day of exposure to air with high PM2.5 levels can lead to bronchitis, asthma attacks and other heart and lung issues. Long-term exposure has been linked with slower lung function growth in children and shorter lifespans for all affected.
For this report, we used the latest annual PM2.5 data to identify the states and large U.S. cities with the best and worst air quality.
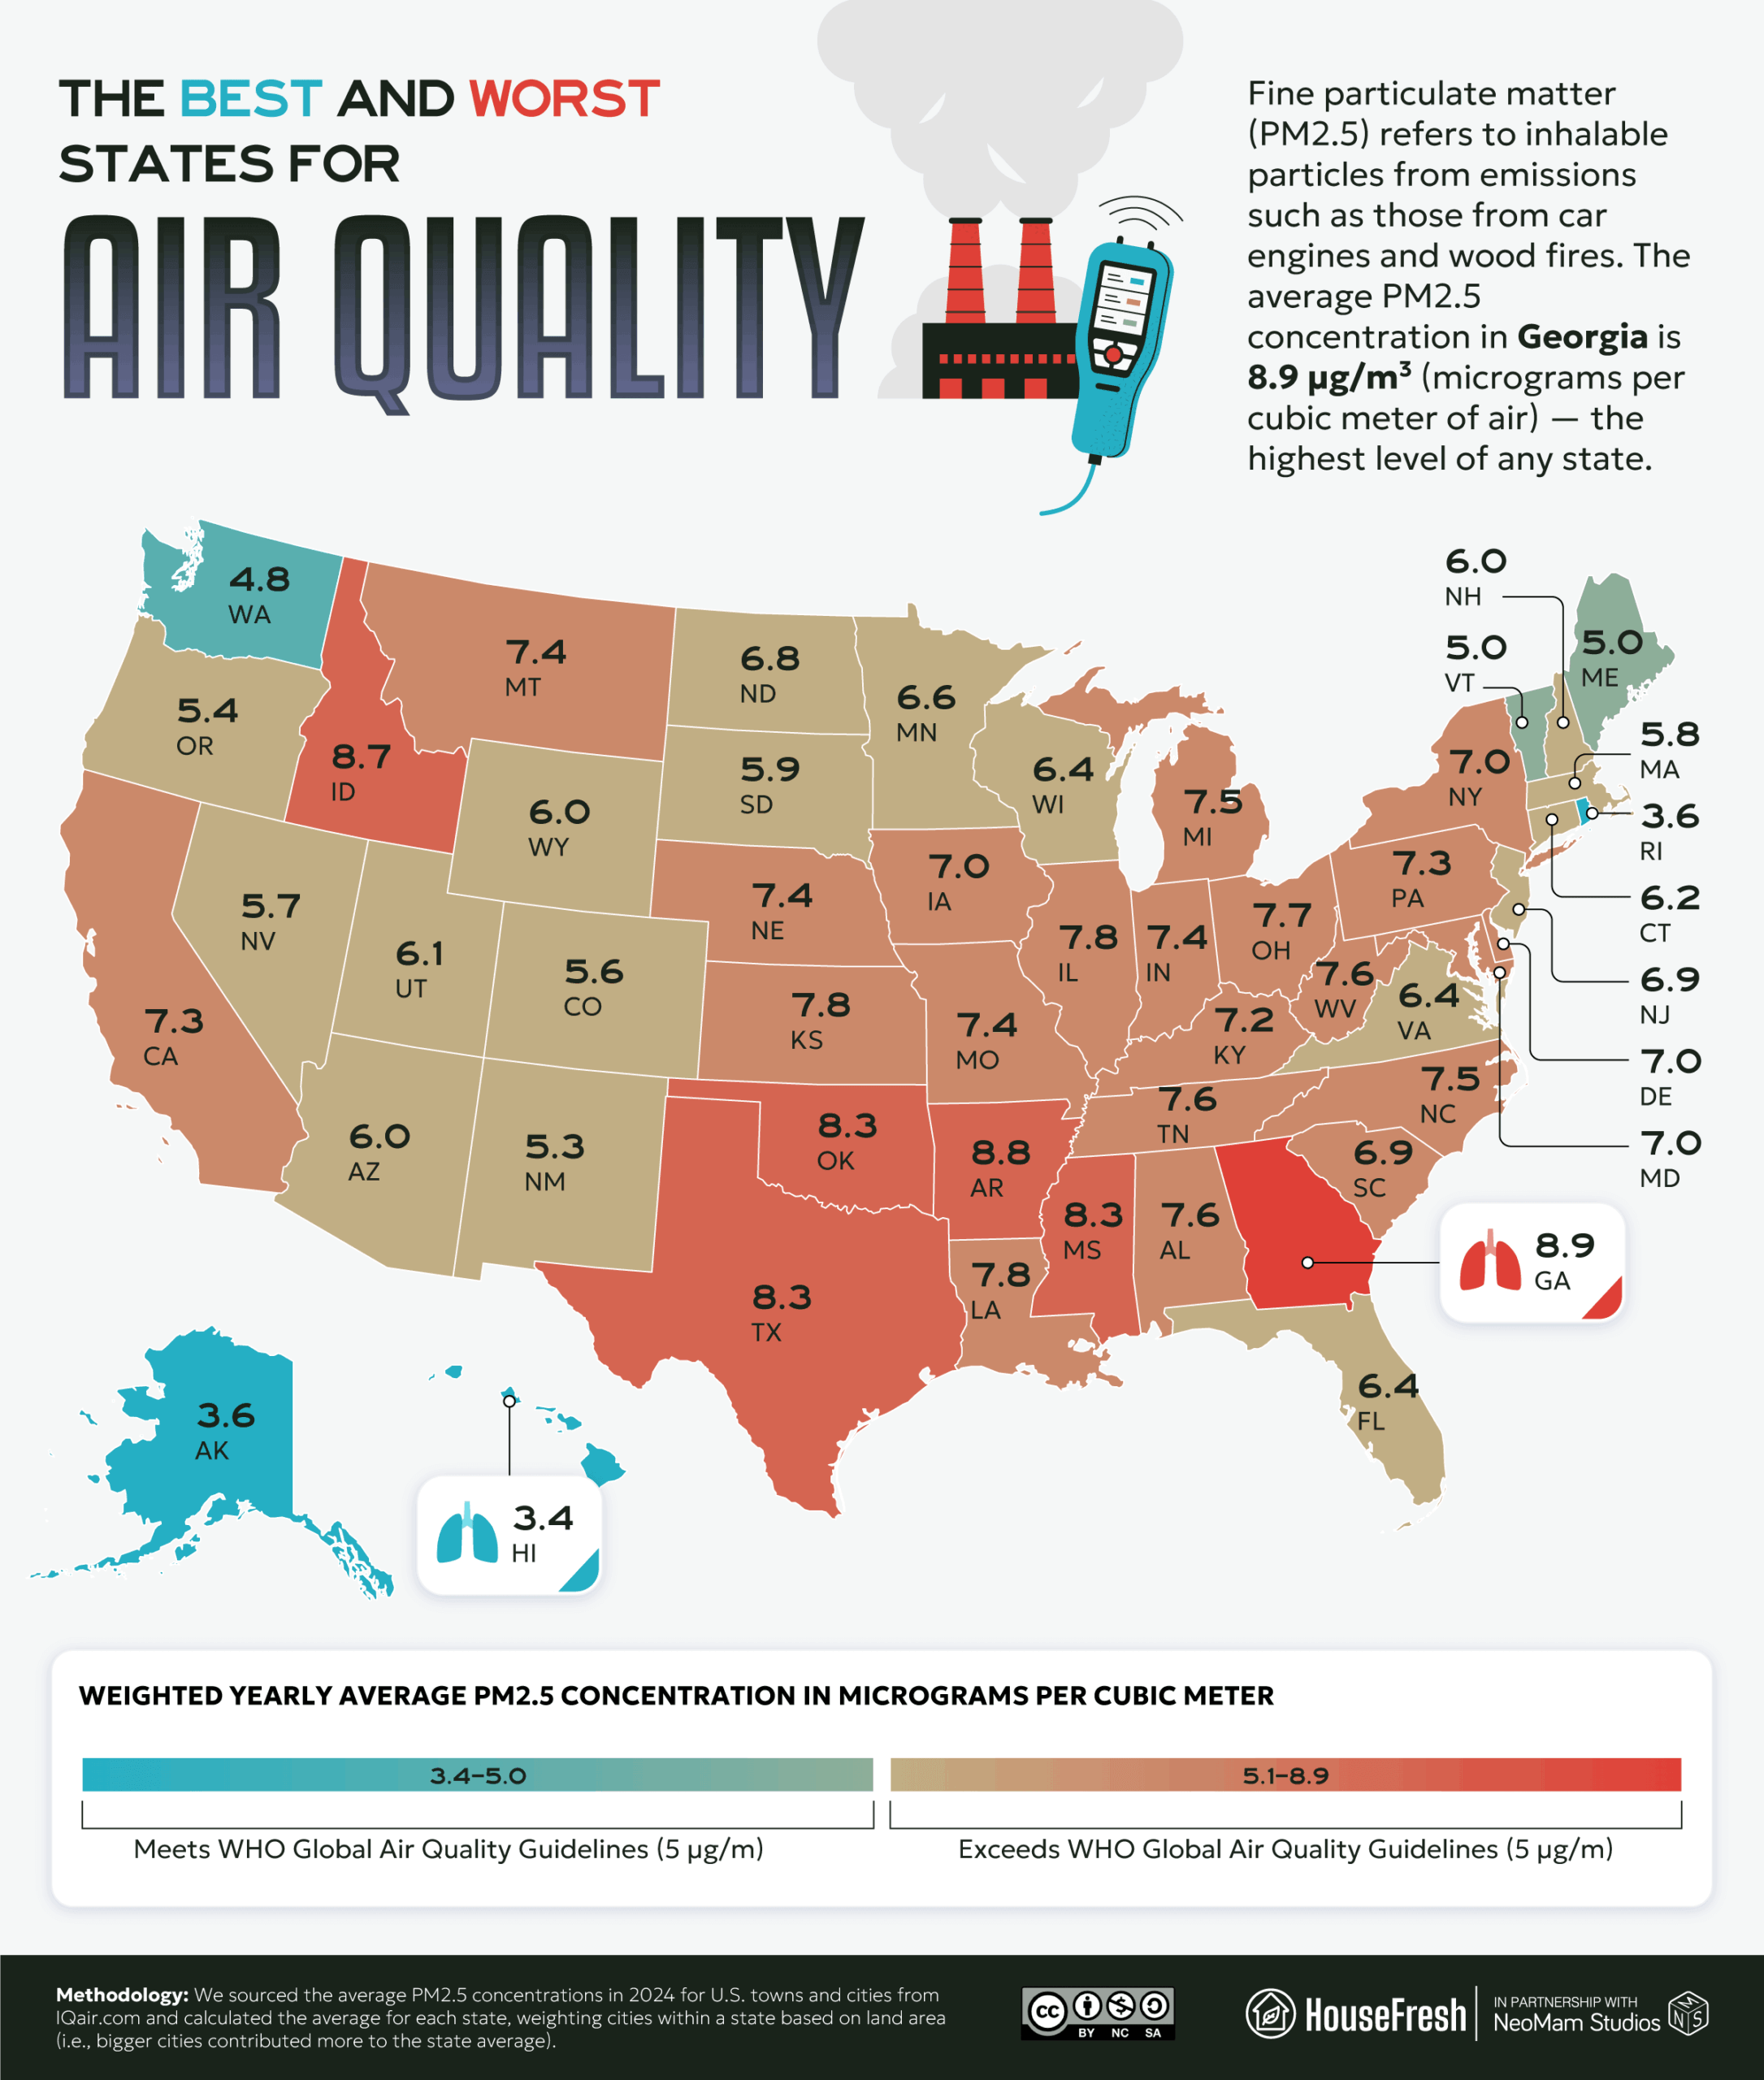
We sourced the average concentration of PM2.5 (fine particulate matter) in the air from IQAir for U.S. towns and cities in 2024. To calculate the average PM2.5 concentration in each state, we weighted cities within a state based on land area (i.e., bigger cities contributed more to the average).
Key findings
- Georgia is the state with the worst air quality, at an average concentration of 8.9 µg/m³ (micrograms per cubic meter of air).
- Hawaii (3.4 µg/m³), Alaska (3.6 µg/m³) and Rhode Island (3.6 µg/m³) have the best air quality.
- Nine of the ten large cities with the worst air are in California, led by Ontario (14.3 µg/m³).
- The large U.S. city with the best air quality is Anchorage, Alaska (3.1 µg/m³).
Georgia has the worst PM2.5 levels in America
Southern states fare worst for air pollution, but Idaho is also among most polluted.
First, we identified the states with the best and worst air. Of the six states with an average PM2.5 concentration of greater than 8 µg/m³, four are adjoining states in the South, with Georgia nearby in the Southeast. Idaho (8.7 µg/m³), in the Northwest, has the third-worst air.
Things look a lot clearer in Hawaii (3.4 µg/m³) and Alaska (3.6 µg/m³), while the Northeastern states of Rhode Island (3.6 µg/m³), Maine (5.0 µg/m³) and Vermont (5.0 µg/m³) join Washington (4.8 µg/m³) among those with a PM2.5 score of 5 µg/m³ or less.
Georgia (8.9 µg/m³) has the worst air overall. Wildfires within state boundaries and from neighboring states are an increasing issue. But the grim irony is that the controlled “prescribed burns” that are used, in part, to mitigate the risk of uncontrolled wildfires are themselves associated with an increase in mortality.
The hot Georgia weather also compounds road emissions. Danna Thompson, an advocacy director at the American Lung Association, notes that when “heading into higher temperatures in the summer in the South, we certainly really encourage people to consider taking and using other forms of transportation, whether it’s biking, walking, taking trains because cars and the trucking industry do impact air quality.” Meanwhile, in April 2025, President Trump exempted Georgia Power’s two coal-firing plants, among dozens nationwide, from emission regulations.
California cities among the best and worst for clean air
Nine out of the 10 most polluted large cities are in California, but Daly City is among cleanest.
Next, we looked at the cities with a population greater than 100,000 to identify the worst and best for air quality. California suffers the best and worst of it: nine of the ten large cities with the highest concentration of fine particulate matter in the air are in the Golden State, but so are five of the ten with the lowest PM2.5 levels.Just four U.S. cities have a PM2.5 score of below 4.0 µg/m³. Daly City, California, scores 3.8 µg/m³, but the city with the best air is Anchorage, Alaska (3.1 µg/m³). In theory, Alaska’s cold climate allows air pollution to linger at ground level, creating disproportionate pollution levels compared to the state’s relatively low population and modest industrial footprint. However, on balance, the state’s low emissions and local efforts to reduce pollution mean that average PM2.5 levels in Anchorage remain low.

In California, highly industrialized areas such as the San Joaquin Valley have historically exceeded Environmental Protection Agency restrictions on air quality, while researchers have shown urban planning to have disproportionately blighted minority communities with excessive vehicular traffic and associated air pollution. By comparison, the quiet suburban city of San Jose is relatively non-industrial, while its position on the peninsula cushions it from higher concentration areas.
“[C]entralized, state-level regulation of air quality in California’s San Joaquin Valley is the only way significant progress on air quality will ever occur,” says Cade Cannedy, a former air quality academic and present Director of Programs at Climate Resilient Communities. “If you really want things to improve, you have to take power away from the polluting industries who are collaborating to stop progress on this front.”
Kansas City is worst Missouri city for fine particulate matter
Mission is the worst in Texas — but escapes accountability on a technicality.
Finally, we identified the city with a population of over 10,000 people with the best and worst air in each state.
Shafter, California (16.1 µg/m³) and Mission, Texas (12.4 µg/m³) are the stand-out cities for bad air by this metric. Shafter has been designated as “at special risk of dust impacts” from harvesting. Local farmers can access 75% subsidies on newer, low-pollution machinery to reduce the dust impact of local almond farming, which can be particularly high during hot, dry spells.
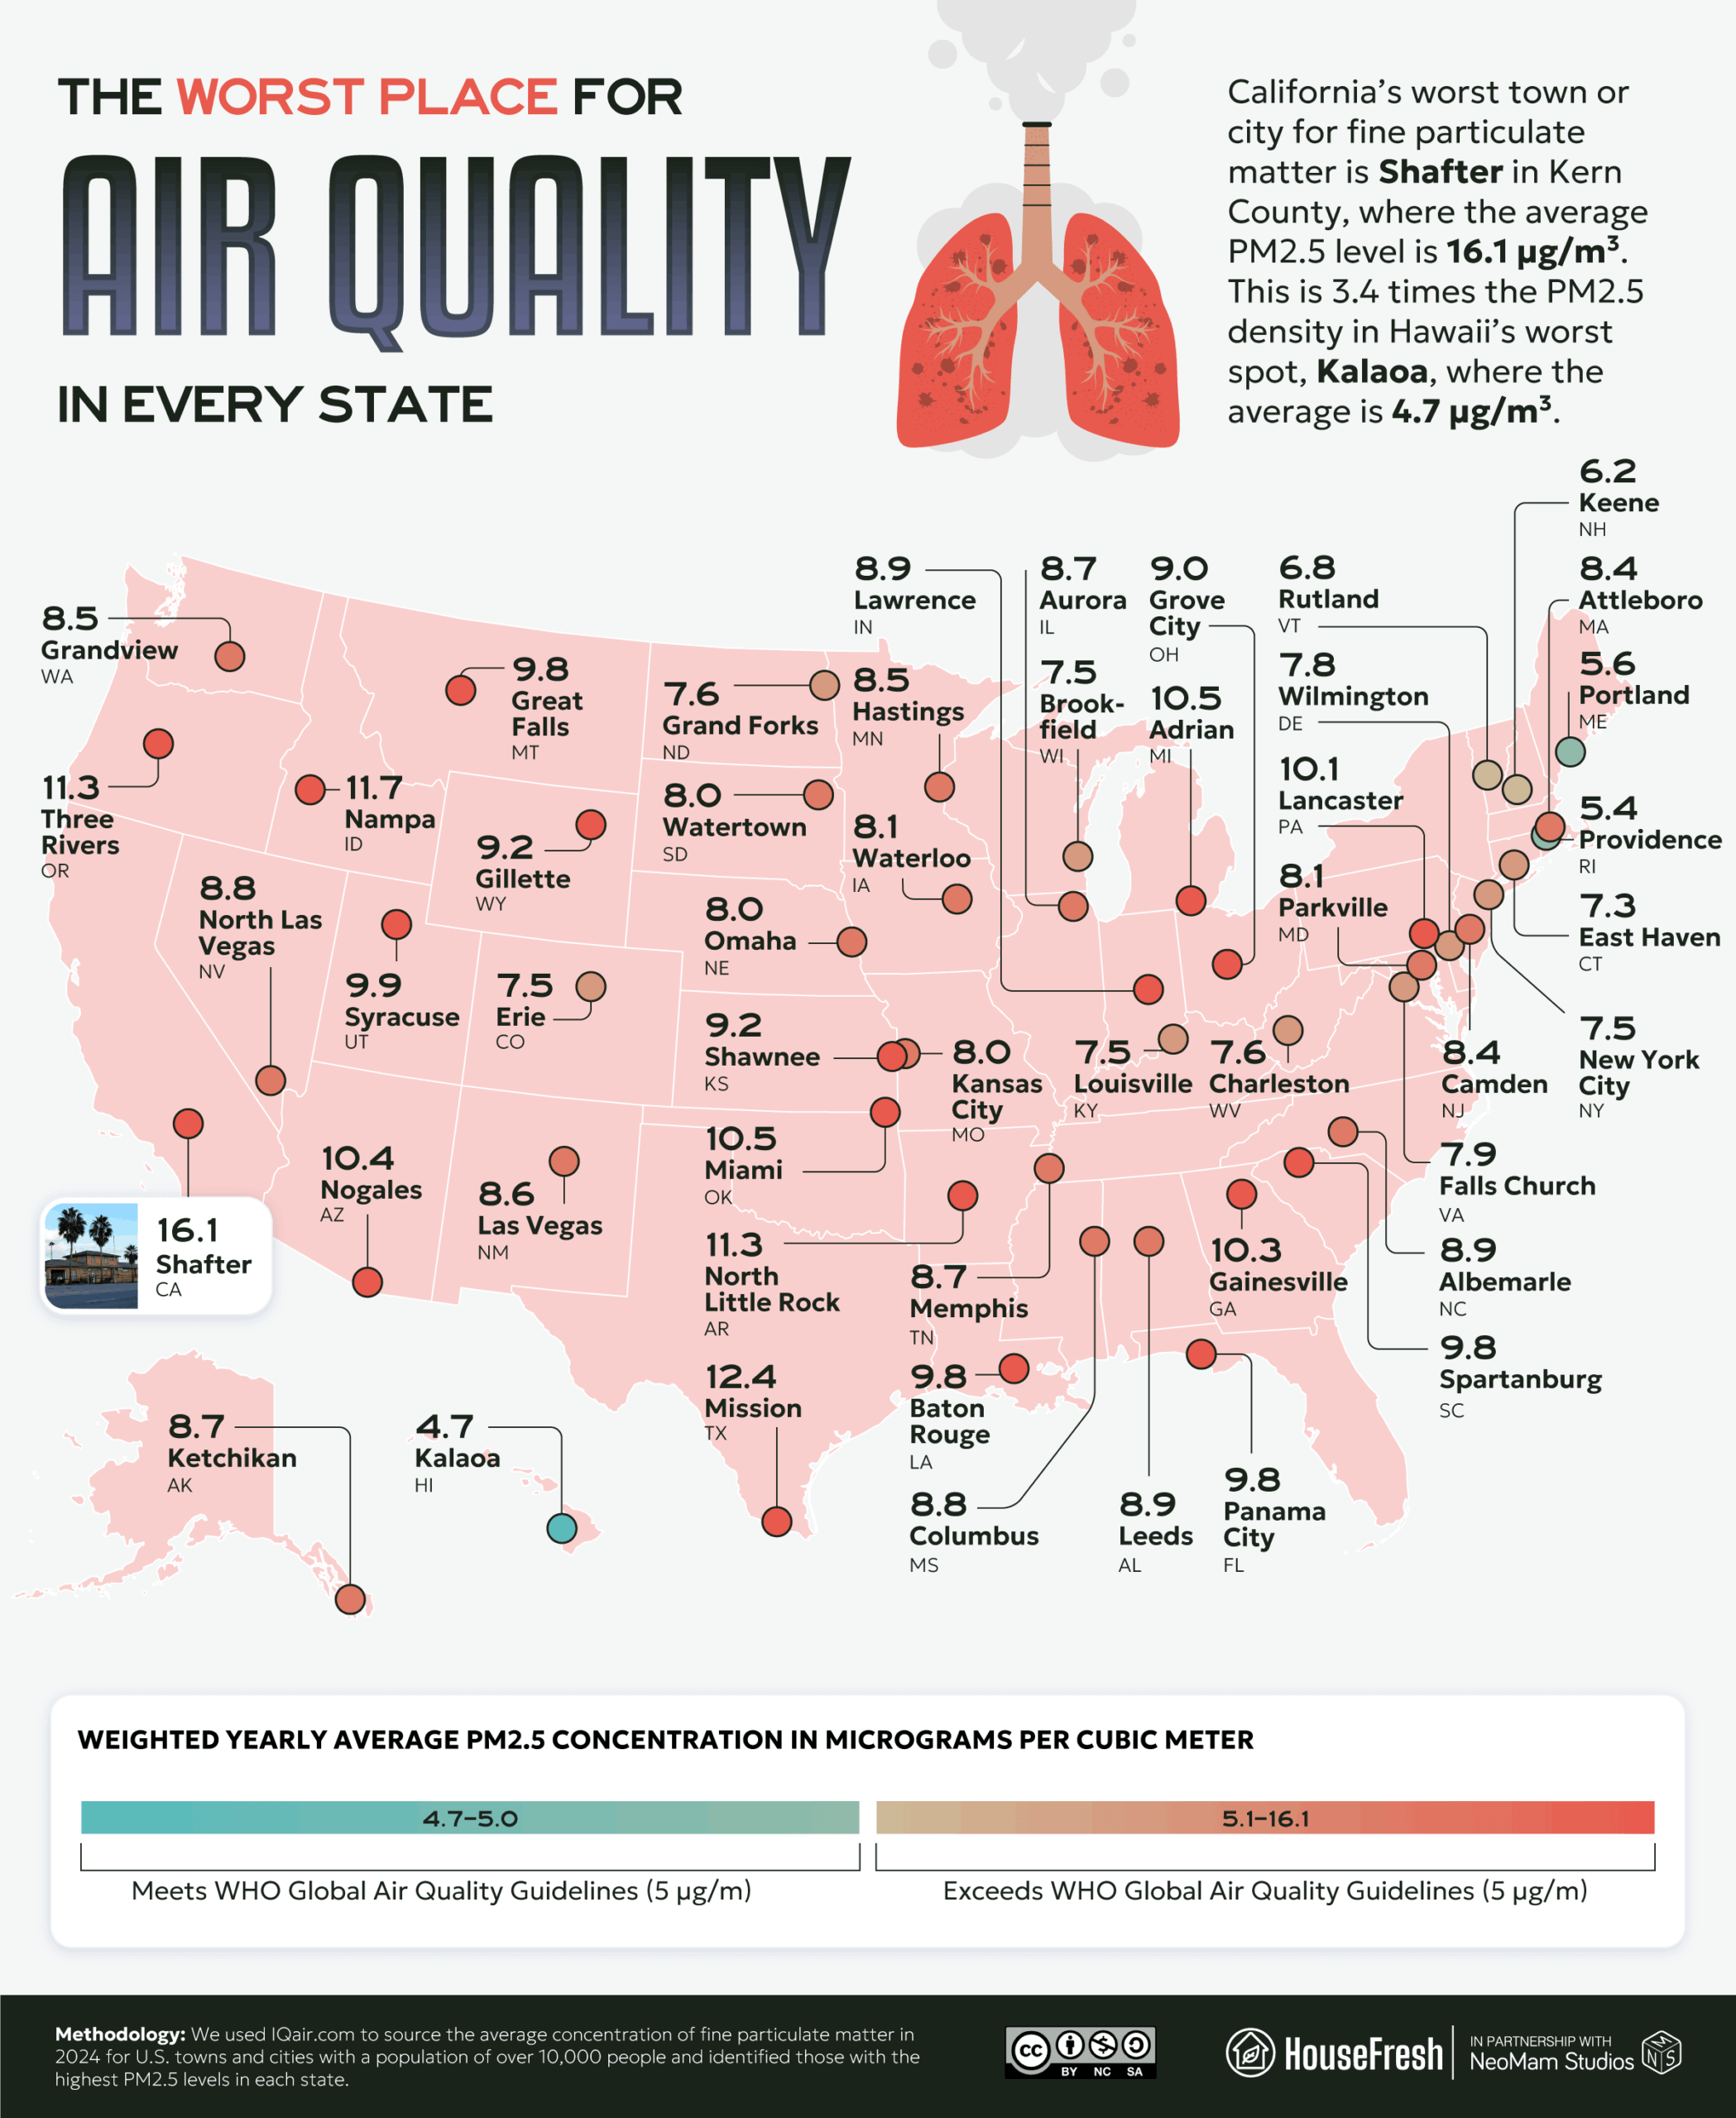
The Texas Commission on Environmental Quality (TCEQ) recently excused Hidalgo County, where Mission is situated, from its failure to keep to federal air standards, saying that a “significant percentage of the trajectories of pollution were from the southerly and/or southeasterly direction, indicating significant international impact.” However, critics have argued that since the standards are primarily in place to keep people safe, such exemptions should not be made, as they discourage efforts to offset ‘excusable’ sources of air pollution.
Waimea, HI, has the best air quality in the country
Gulfport is the least polluted city in Mississippi but PM2.5 concentrations still exceed WHO guidelines
The Mississippi city with the best air is Gulfport (7.6 µg/m³) — however, this is the worst “best air” of any state. Huntington, West Virginia, is not far behind with 7.5 µg/m³.
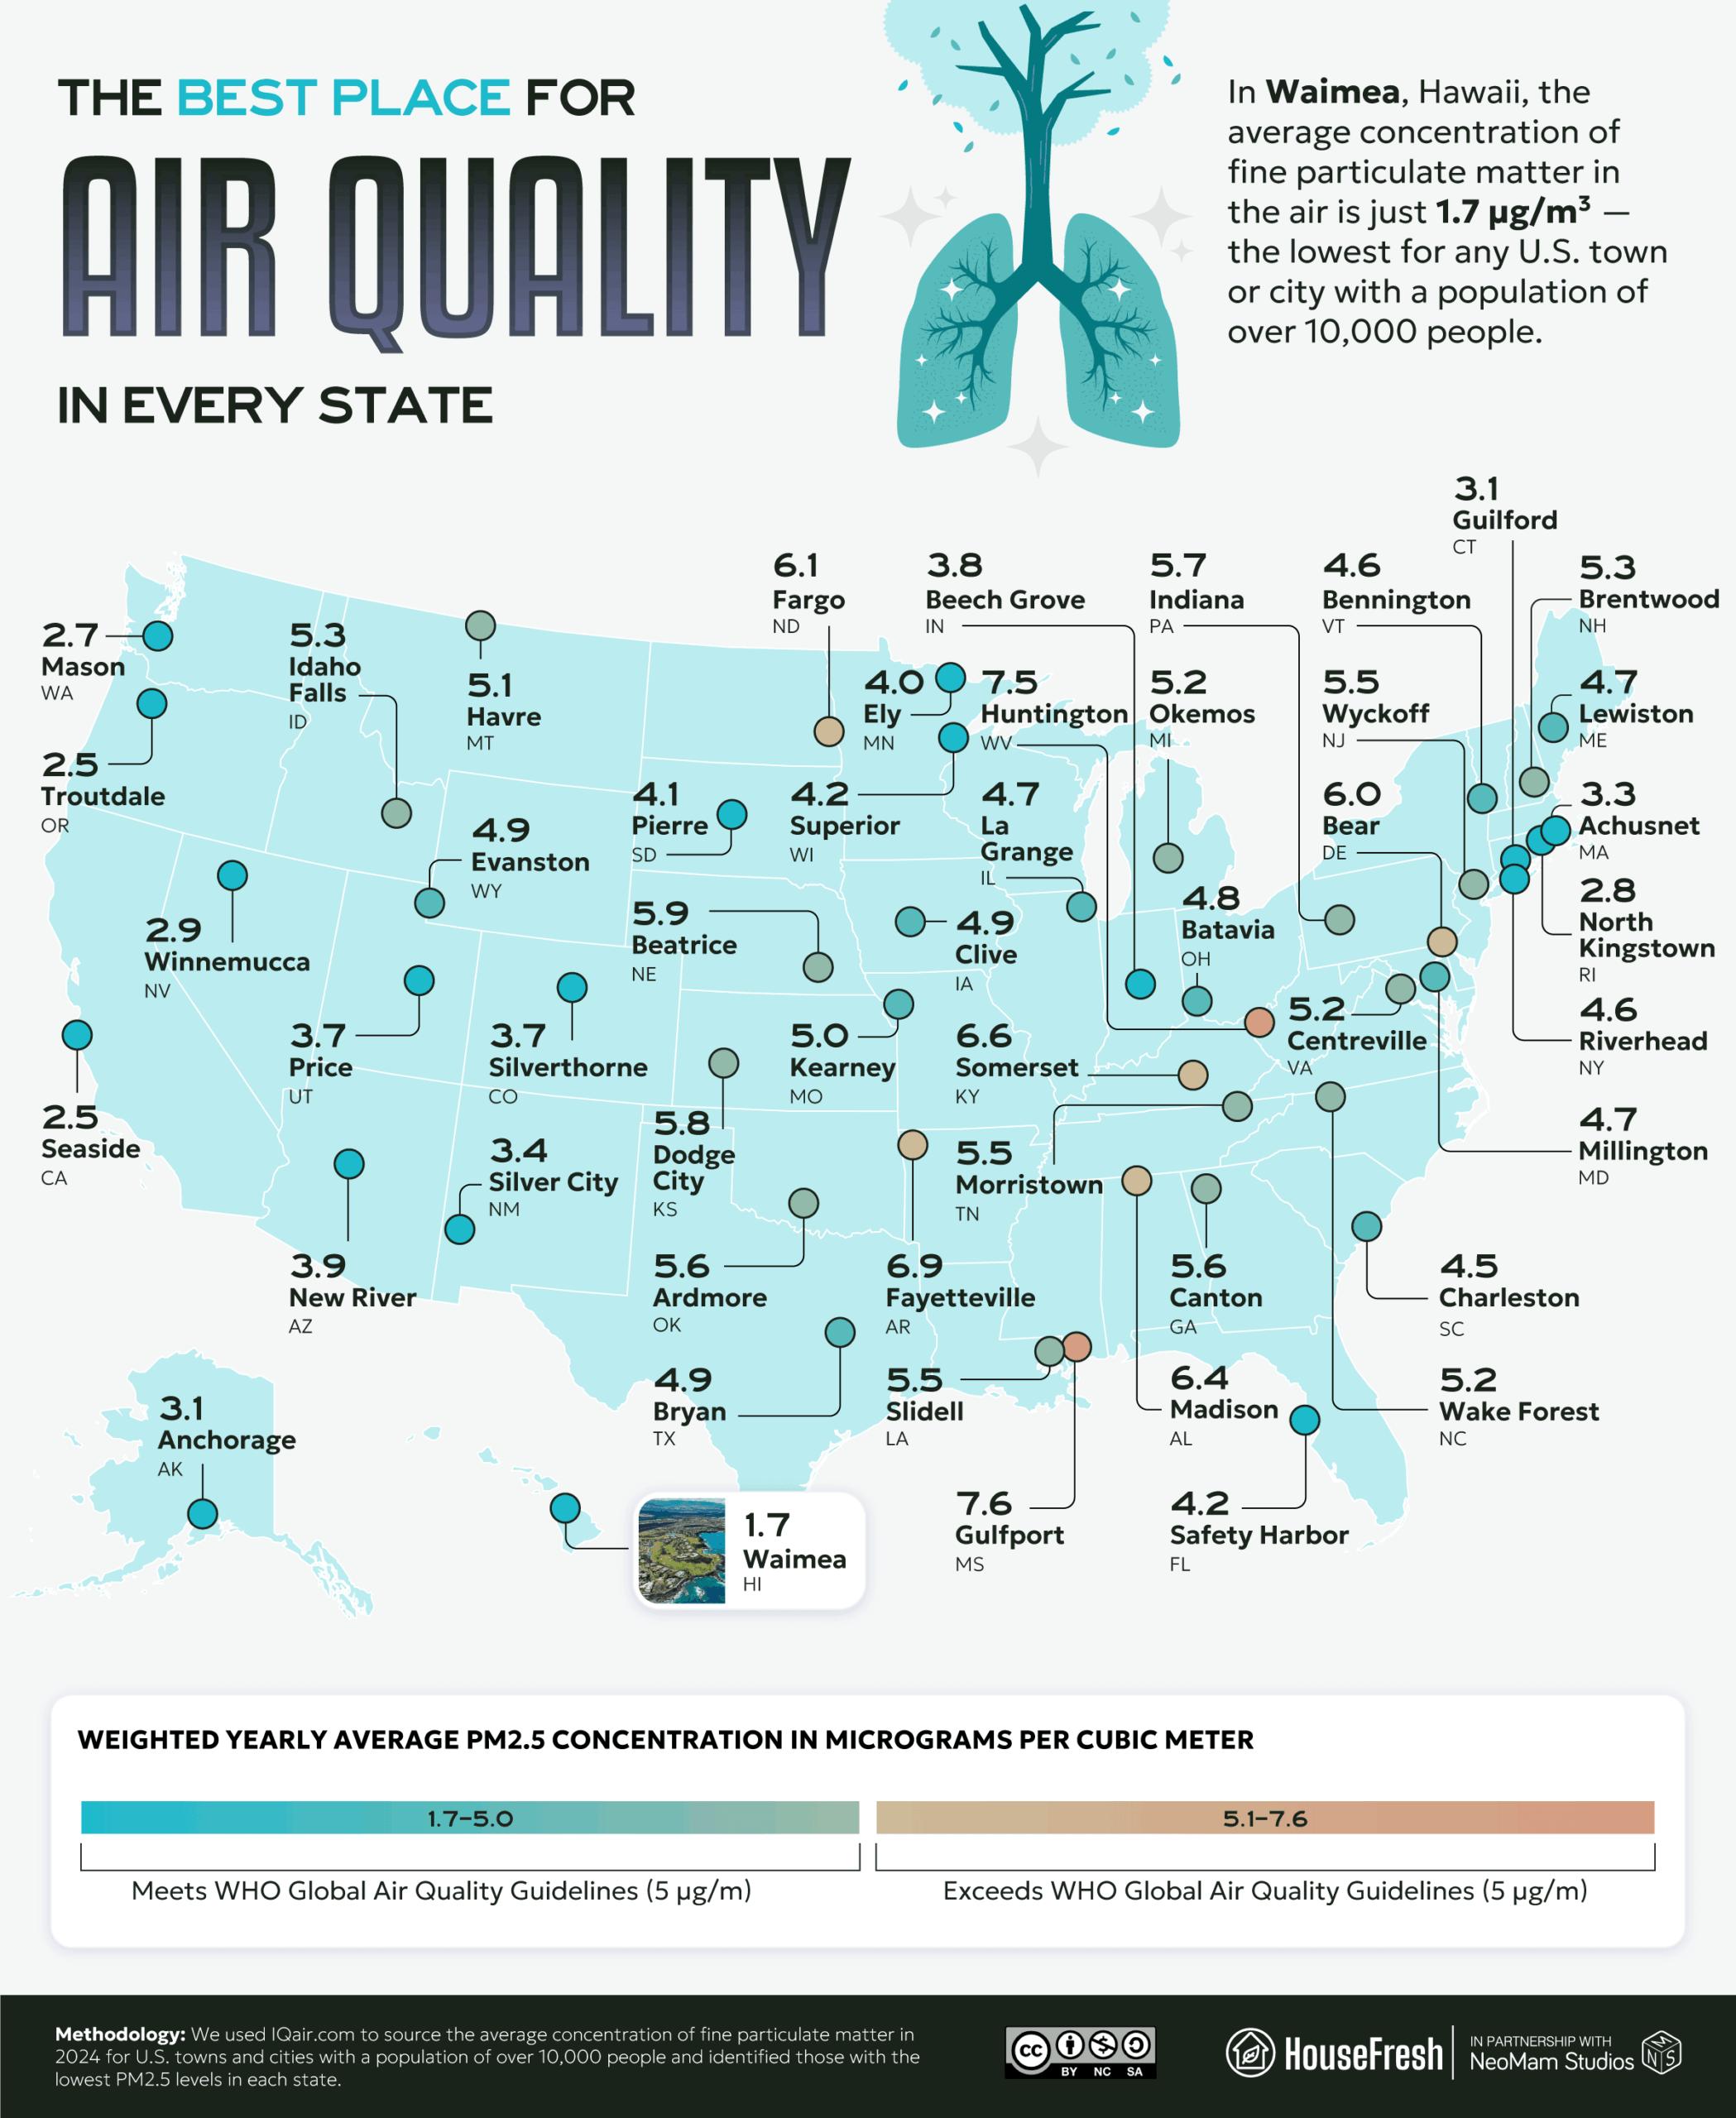
Among cities with the cleanest air in each state, Waimea, Hawaii (1.7 µg/m³), Troutdale, Oregon (2.5 µg/m³) and Seaside, California (2.5 µg/m³) stand out as the cleanest of all. Hawaii is vulnerable to a peculiar form of fine particulate matter: volcanic smog, or “vog” — “a hazy mixture of SO2 gas and aerosols (tiny particles or droplets) which are primarily sulfuric acid and other sulfate (SO4) compounds.” However, the relative isolation of the Hawaiian Islands and the influence of trade winds help to keep the air relatively clear.
131 million Americans breathe bad air
The air quality divide is palpable, but things are getting worse for all.
The American Lung Association has found that nearly 40% of Americans, or 90 million people, live in places where the air quality fails to meet recent Environmental Protection Agency standards, while 131 million live with unhealthy levels of ozone or particle pollution.
These areas can be divided by location but, in many cases, also by socio-economic conditions. But cities known for their relatively clean air are also suffering from a decline in standards. And the rollback in environmental legislation, along with the increase in wildfires, means many can expect to enjoy fewer good air days as summer — and the planet — heats up.
METHODOLOGY
We sourced the average PM2.5 concentrations for 2024 as reported by IQAir’s air quality rankings. To calculate the average PM2.5 concentration by state, we weighted cities within a state based on land area (i.e., bigger cities contributed more to the average). To uncover the most and least polluted cities, we ranked cities with the highest and lowest average 2024 PM2.5 concentrations from those with a greater than 100k population. In order to find the best and worst places by state, we lowered the population threshold to 10k to determine the towns or cities with the best/worst air quality overall across each state.