Take a deep breath – if you didn’t break out in a fit of coughing, you’re one of the more fortunate ones. The air we breathe is often taken for granted but air pollution rates have risen over the years as the inevitable consequence of globalization. 7 million people die prematurely each year from air pollution, with 600,000 of these being children. According to the World Health Organization (WHO) “this mortality is due to exposure to fine particulate matter of 2.5 microns or less in diameter (PM2.5), which causes cardiovascular and respiratory diseases, and cancers.”
But what exactly is polluting our air, and how do we measure it? Air pollution encompasses more than what we can see, feel, and smell. Emissions from vehicles, fossil fuels, chemical production, and power generation all play a part in releasing hazardous substances into our environment. Even natural events such as volcanic eruptions and methane from decomposing organic matter contribute to air quality.
The World Health Organization (WHO) have released guidelines that set targets for the amount of PM2.5 a city should aim to have in its air, measured in µg/m³. To help demystify these targets we have labeled any above the official WHO target of 0-5 µg/m³ from good (5.1-10 µg/m³) to extremely toxic (>50 µg/m³).
Matching these targets up with IQAir’s World Air Quality Report 2021, has given us a comprehensive look into how our towns and cities have been doing for the last year.
We found that:
- Bangladesh takes the top spot as the most polluted country, followed by Chad, Pakistan, Tajikistan and India.
- The top 50 most polluted cities worldwide can be found in just 7 countries, India, Pakistan, Kazakhstan, Bangladesh, China, Chad and Turkey.
- While 35 of the top 50 most polluted cities can be found in India alone, with Bhiwadi being the worst overall, reaching a PM2.5 rating of 106.2µg/m3.
- Chu (Kazakhstan) is the city with the cleanest air with a PM2.5 of just 1.5µg/m3.
- Australia claims 12 of the top 20 cities with the cleanest air with St Helens being the cleanest in the country.
- Weaverville in wildfire-ravaged California had the dirtiest air in America with a PM2.5 of 34.7µg/m3.
The top three towns and cities in the world with the best air were Chu (Kazakhstan) with a PM2.5 of 1.5µg/m3, St. Helens (Australia) with a PM2.5 of 1.9µg/m3 followed by Judbury (Australia) with a PM2.5 of 2.0µg/m3. Surprisingly, Chu manages to maintain an incredible level of air pollution despite being a city with over 37,500 residents. St. Helens and Judbury on the other hand are rural regions in Tasmania with smaller population sizes of only 2,070 and 392.
Four of the top five worst cities can be found in India, with Bhiwadi (Rajasthan) taking the top spot with a PM2.5 of 106.2µg/m3. Followed by Ghaziabad in second and Delhi in fourth. The Rajasthan State Pollution Control Board recently attributed Bhiwadi’s toxic air to its large scale industries and high volume of vehicle traffic, with similar fates affecting Ghaziabad and Delhi.
However, 2021 saw some of India’s worst air pollution on record thanks in part to the abundance of fireworks set off during Diwali celebrations coinciding with agricultural crop burning which takes place at the start of winter, despite being outlawed in 2015.
Natural disasters also impact air quality levels significantly. Hotan (Xinjiang, China) is the third most polluted city in the world in 2021 with a PM2.5 of 101.5µg/m3 after being the most polluted globally in 2020. These ratings have largely been attributed to local sandstorms, given its location at the southwestern edge of Taklimakan Desert, the world’s largest shifting sand desert.
Neah Bay, Washington, had America’s cleanest air in 2021
The cleanest city award in North America went to remote city Neah Bay, Washington, with a PM2.5 of 3.1µg/m3. According to IQAir, the U.S. emerged as the 28th country with the cleanest air out of 117 countries. Home to 332 million people, the U.S. scored a healthy average AQI of 43 in 2021.
Raymond, also in Washington and Hilo in Hawaii were the next U.S cities with the cleanest air, both scoring an average PM2.5 of 3.2µg/m3. Hilo is a popular tourist destination as home of the world’s preeminent hula competition, while Raymond is a city of only 3000 people, built on a small industry of logging and fishing.
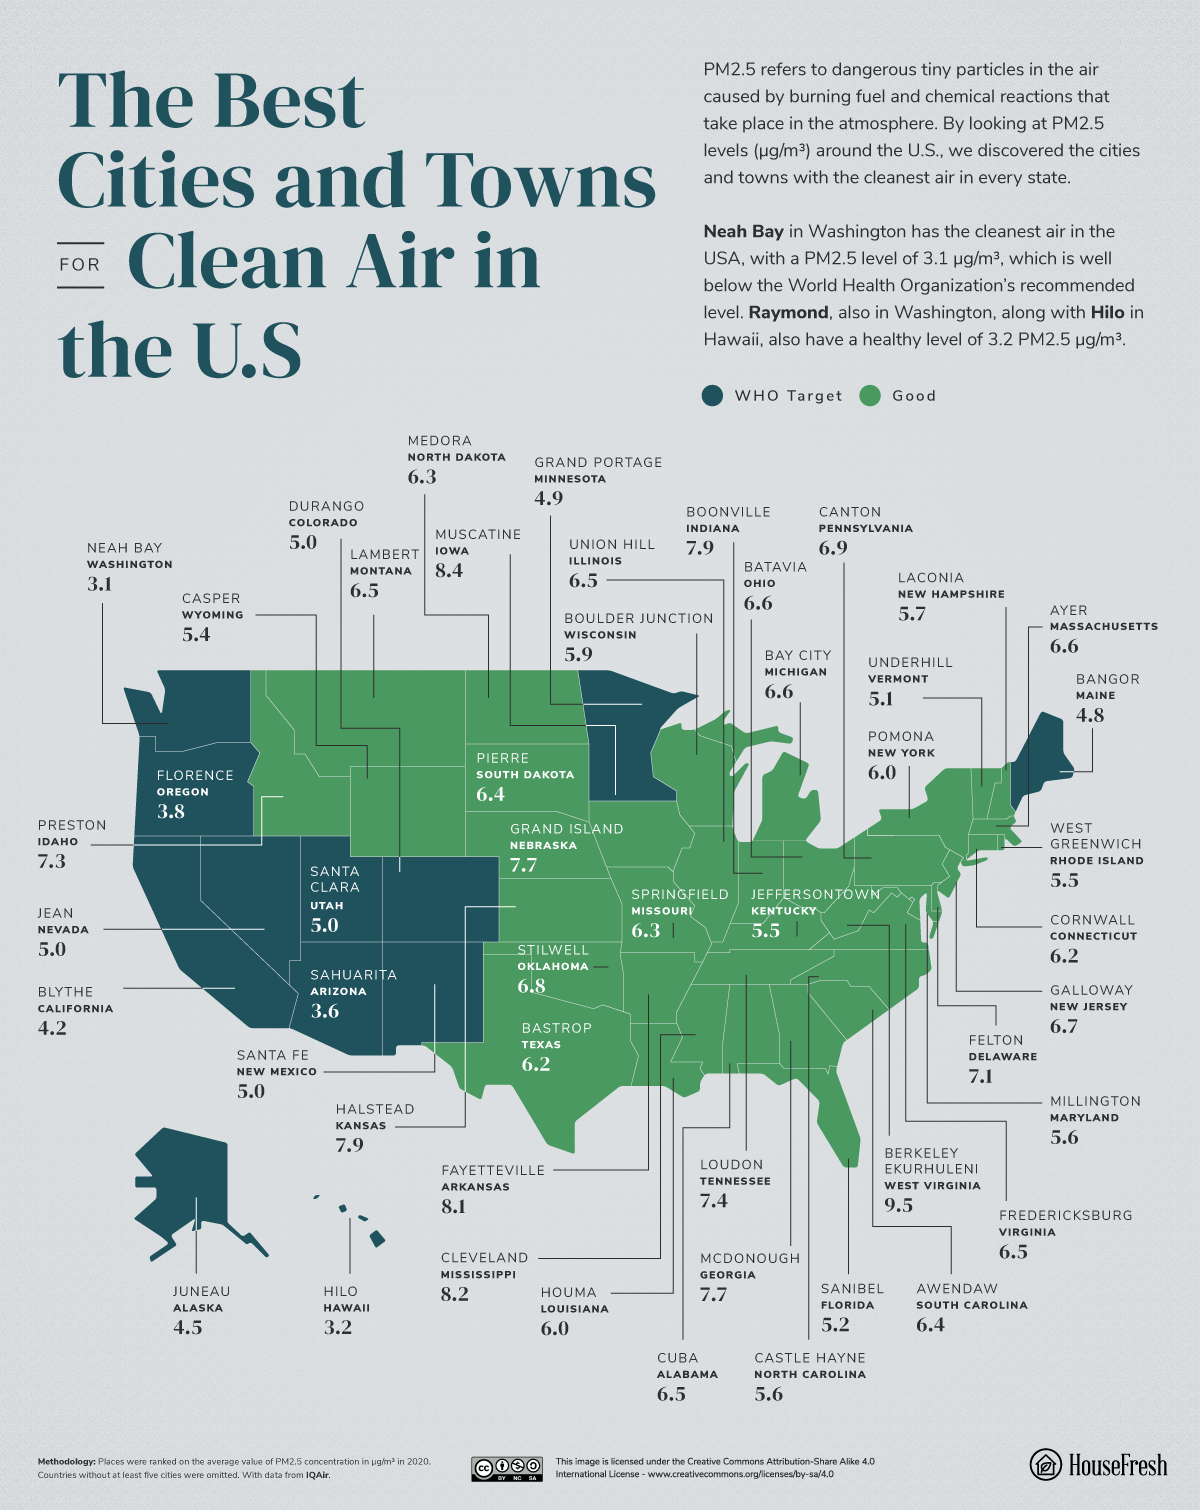
Click on the image to open the map in full size
2021 marked the 51th anniversary of the U.S. Clean Air Act in 1970, which put into place comprehensive federal and state regulations that aimed to cut down air pollution. As of 2019, the Environmental Protection Agency (EPA) reports a 77% drop in air pollutants while the country experienced a growth in the gross domestic product by 324%.
Banning lead from motor vehicle gasoline was a key achievement of the Clean Air Act. Removing thousands of tons of lead from the air is projected to have prevented 205,000 early deaths and 10.4 million lost I.Q. points in children, which would have resulted from continued lead exposure.
Improved air quality also helped preserve our forests, aquatic life, and soil. The agricultural industry enjoyed boosted crop and timber yields, benefits which were estimated to be worth $5.5 billion in 2010.
Weaverville, California, was the worst American city for clean air in 2021
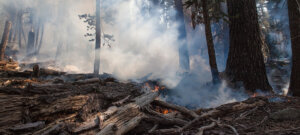
Despite 2020 seeing the country’s largest wildfire in over 18 years, 2021 brought about new challenges and more worrying trends as the US continued to experience longer wildfire seasons. Wildfires burned 2.6 million acres of land cumulatively in California alone and were reported to contribute as high as 70% of particulate pollution on any given day.
As the fires started unusually early in the year, January alone saw almost triple the number of fires burning more than 20 times the five-year average acreage. With no rainfall for over 200 days, the fires ravaged much of the California until October, creating toxic air for millions of people across the West and beyond for prolonged periods across the year.
As a result, Weaverville, California, found itself the most polluted city in America, with a PM2.5 of 34.7µg/m3. During the peak of the wildfire season, Weaverville recorded a PM2.5 of 246.6µg/m3, more than double the average of the world’s worst city Bhiwadi. What’s more, California was the home of 22 of the 25 worst cities across the US for PM2.5 pollution.
Outside of California, Minden (Nevada) came in 11th place with a PM2.5 of 25.5µg/m3 and Terrell (Texas) came in 14th with a PM2.5 of 24.7µg/m3. From analyzing the data across the year, we see that Minden may also be a victim of wildfire smoke. As the city which lies close to the Nevada-California border, met the WHO Target between January and May only to see levels of PM2.5 spike during wildfire season.
Terrell on the other hand, registered an unhealthy level of air pollution throughout the year. Registering its lowest level in May with 19.2µg/m3 which is still deemed to be unhealthy for sensitive groups and peaking in August at 31.724.7µg/m3 which nears toxic levels.
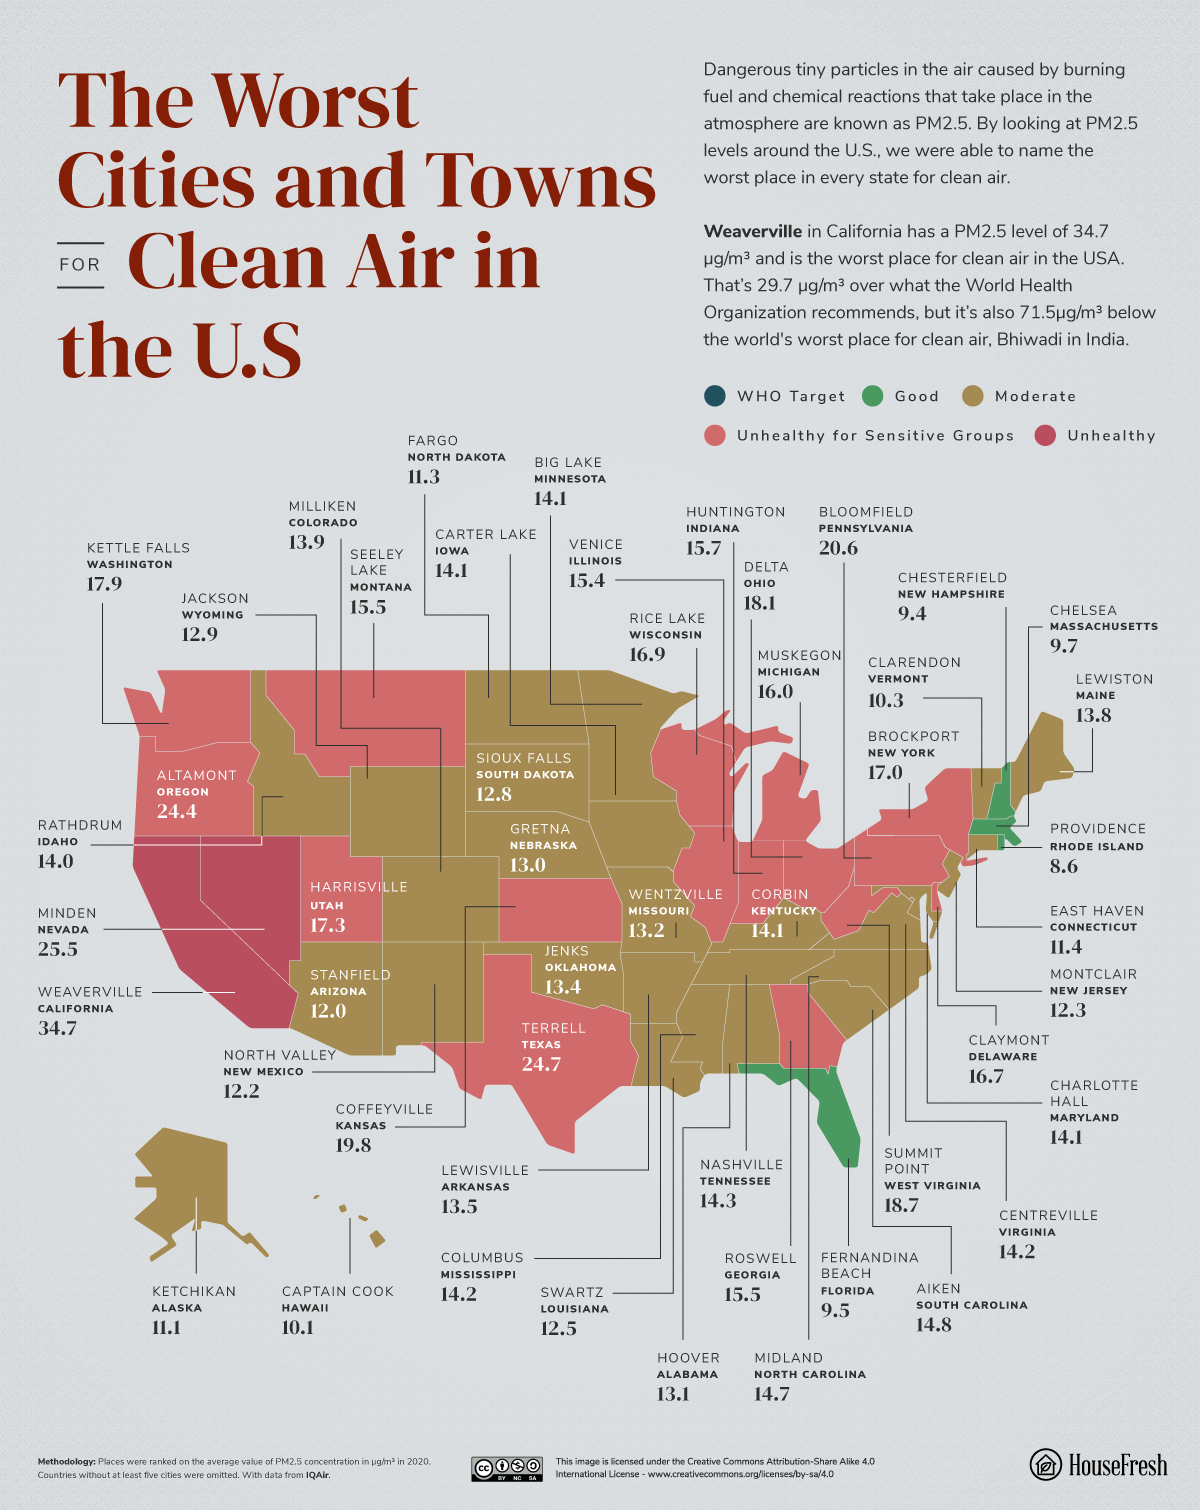
Click on the image to open the map in full size
Although the U.S. has made significant progress in combating air pollution, there is still room for improvement. Climate change resulting from greenhouse gas accumulation and thinning of the ozone layer causes more severe wildfires, worsened drought, heavier rains, and floods, as well as more intense hurricanes and storms. Natural disasters confer tumultuous effects on livelihoods, communities, and the nation’s economy.
In addition to EPA’s stricter enforcement of vehicle and industrial emissions, the U.S. is also working with the rest of the world via the international Montreal Protocol to phase out the production of ozone-destroying substances such as hydrochlorofluorocarbons (found in refrigerants and air conditioning).
Clean air inside and out – the embodiment of hood health
The American Lung Association State of the Air 2021 report found that despite nationwide efforts in controlling air pollution, more than 40% of Americans – over 135 million people – are still living in areas with unhealthy particulate pollution and ozone levels.
9 out of 10 urban dwellers are affected by air pollution. Children are particularly at risk of air impurities, with even low levels of PM2.5µg/m3 exposure linked to structural changes in their developing brains. Additionally, children whose mothers were exposed to high levels of particulate matter during pregnancy are more at risk of autism, attention-deficit and hyperactivity disorder (ADHD), and low birth weight.
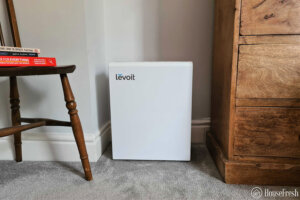
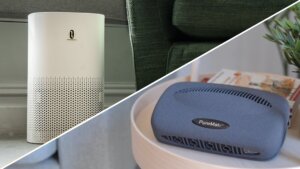
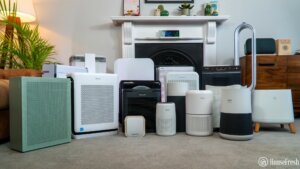
It is crucial for you to ensure that the air that you and your loved ones are breathing in is clean. Indoor air quality (air inside buildings and structures) relates closely to our well-being. Indoor air purification is shown to improve indoor PM2.5 concentrations (11). The EPA recommends the use of centralized or portable air filters to ventilate the home and to reduce air pollutants.
Key features that a good air filter should have are:
- A high-efficiency particulate air (HEPA) filter for particle filtration.
- An efficient low leakage system.
- There is a ton of peer-reviewed benefits of air purifiers.
- An activated carbon filter for gas and odor filtration.
Stay vigilant and get involved in your lung health today before it’s too late.
METHODOLOGY & SOURCES
We collected the data about the best and worst places for clean air using IQAir. Cities and towns were ranked on the average value of PM2.5 concentration in µg/m³ in 2021. Countries without at least two cities were omitted.
Our labels for the targets set by the WHO are as follows:
0-5 µg/m³ = WHO target
5.1-10 µg/m³ = Good
10.1-15 µg/m³ = Moderate
15.1-25 µg/m³ = Unhealthy for sensitive groups
25.1-35 µg/m³ = Unhealthy
35.1-50 µg/m³ = Toxic
>50 µg/m³ = Extremely Toxic
- Cherrie J. W, Apsley, A, Cowie, H, Steinle, S, Mueller, W, Lin, C, Horwell, C.J, Sleeuwenhoek, A, Loh, M. (2018). Effectiveness of face masks used to protect Beijing residents against particulate air pollution. oem.bmj.com
- Hsiao-Chi Chuang, Kin-Fai Ho, Lian-Yu Lin, Ta-Yuan Chang, Gui-Bing Hong, Chi-Ming Ma, I-Jung Liu, Kai-Jen Chuang. (2017). Long-term indoor air conditioner filtration and cardiovascular health: A randomized crossover intervention study. ncbi.nlm.nih.gov
- ACS. (2016). Selecting the right house plant could improve indoor air (animation). acs.org
- Laskowski, E.R. (2021). Does air pollution make outdoor exercise risky? yahoo.com
- IQAir. (2021). How does outdoor air pollution affect my indoor air quality? iqair.com
- Dockery DW, Pope CA, 3rd, Xu X, Spengler JD, Ware JH, Fay ME, et al. (1993). An association between air pollution and mortality in six U.S. cities. nejm.org
- Li, J., Wang, S., Chu, J. et al. (2018). Characteristics of air pollution events over Hotan Prefecture at the southwestern edge of Taklimakan Desert, China. springer.com
- NASA. (2021). 2020 tied for warmest year on record, NASA analysis shows. nasa.gov
- Government of the People’s Republic of Bangladesh. (2019). Bangladesh Economic Review (BER) 2019: Ministry of Finance. mof.gov.bd
- Islam MS, Tusher TR, Roy S, Rahman M. (2020). Impacts of nationwide lockdown due to COVID-19 outbreak on air quality in Bangladesh: a spatiotemporal analysis. springer.com
- Kurt OK, Zhang J, Pinkerton KE. (2016). Pulmonary health effects of air pollution. ncbi.nlm.nih.gov
- Cserbik D, Chen JC, McConnell R, Berhane K, Sowell ER, Schwartz J, et al. (2020). Fine particulate matter exposure during childhood relates to hemispheric-specific differences in brain structure. sciencedirect.com
- Raz R, Roberts AL, Lyall K, Hart JE, Just AC, Laden F, et al. (2015). Autism spectrum disorder and particulate matter air pollution before, during, and after pregnancy: a nested case-control analysis within the Nurses’ Health Study II Cohort. ncbi.nlm.nih.gov
- Perera FP, Chang HW, Tang D, Roen EL, Herbstman J, Margolis A, et al. (2014). Early-life exposure to polycyclic aromatic hydrocarbons and ADHD behavior problems. ncbi.nlm.nih.gov
- Dadvand P, Parker J, Bell ML, Bonzini M, Brauer M, Darrow LA, et al. (2013). Maternal exposure to particulate air pollution and term birth weight: a multi-country evaluation of effect and heterogeneity. ncbi.nlm.nih.gov
- Yoda Y, Tamura K, Adachi S, Otani N, Nakayama SF, Shima M. (2020). Effects of the Use of Air Purifier on Indoor Environment and Respiratory System among Healthy Adults. ncbi.nlm.nih.gov


