
Fine particulate matter (PM2.5) is a form of air pollution made up of particles that are 2.5 micrometers or smaller. These particles can get into your lungs and bloodstream, causing respiratory and circulatory issues and even premature death.
In the U.S., wildfire smoke accounts for 25% of PM2.5 pollution and is predicted to drive a 27% increase in the number of “hazardous” air days — when PM2.5 concentration is 301 μg/m³ or higher — by 2050. The World Health Organization (WHO) recommends that a city’s annual PM2.5 levels should average no more than 5 µg/m³.
We were curious to see how major global cities perform in relation to this WHO guideline on a daily basis. So, we used data from the AQICN database to count the number of days where air pollution remained below 5 µg/m³ in 437 cities across 60 countries in the past year.
First, we converted PM2.5 AQI values for 437 major global cities from the AQICN database into PM2.5 concentration levels (μg/m³). Then, we calculated the number of “safe air days” for each city during a full year, defining a safe day as one with PM2.5 concentration below 5.0 μg/m³, in line with the World Health Organization’s air quality guidelines. Finally, we ranked the cities in our study based on their estimated number of safe air days per year.
Key findings
- Perth (Australia) and San Salvador (El Salvador) enjoyed safe air every single day in a year, with the concentration of fine particulate matter averaging below 5.0 μg/m³.
- Of the 437 major global cities we analyzed, 23 cities had zero safe air days in a year, including Abu Dhabi, Delhi, Bangkok, and Lima.
- In the U.S., Honolulu had the most safe air days (346), and Houston had the fewest (55).
- The major European city with the most safe air days was Funchal (Portugal) with 343 days, and the one with the least was Wrocław (Poland) with only 5 safe air days.
- Edinburgh (279 days) is the UK city with the most safe air days, and Leeds has the fewest (127).
Perth and San Salvador achieved 365 days of safe PM2.5 levels
Ranking the 25 major global cities with the most safe air days each year.
We identified two cities where every day in a year was a safe air day, i.e., average PM2.5 levels were below 5 μg/m³: Perth, Australia, and San Salvador, El Salvador. Of these, Perth had slightly cleaner air, maintaining an average PM2.5 level of 6.1 μg/m³ throughout a year, compared to 9.0 μg/m³ in San Salvador.
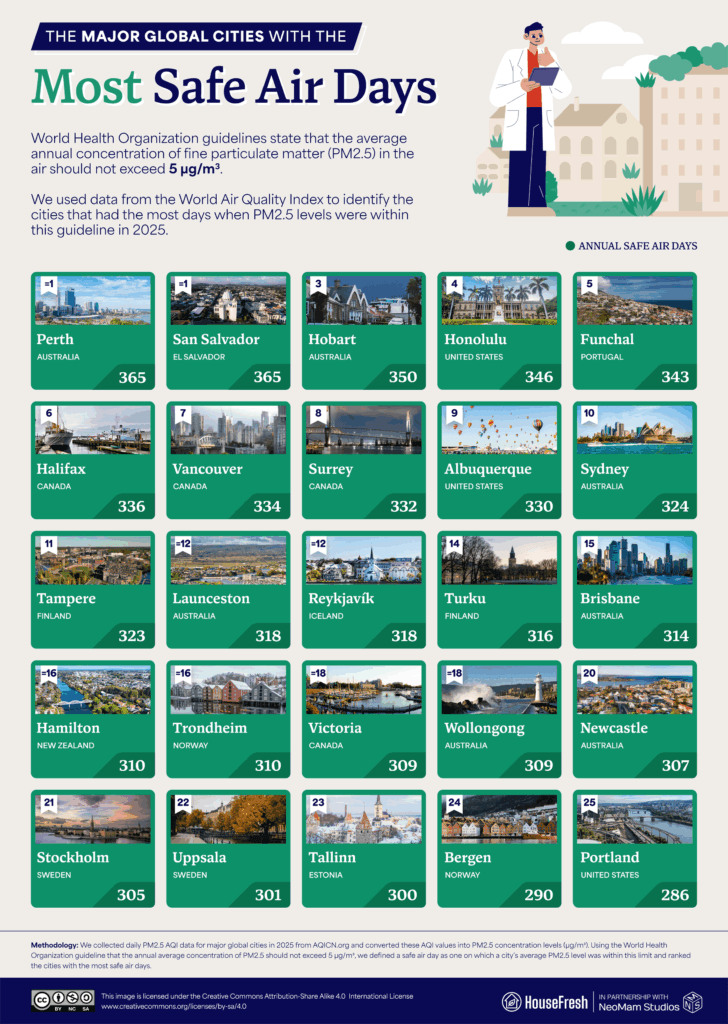
There are also two U.S. and four Canadian cities that achieved more than 300 safe air days in a year. In fact, Honolulu had the fourth-highest number of safe air days (346) among major global cities with available data.
The Canadian cities of Halifax, Vancouver, and Surrey, as well as Albuquerque in the U.S., and Sydney and Brisbane in Australia, all recorded average PM2.5 levels of below 20 μg/m³ across the year.
23 major global cities had zero safe air days in a year
Delhi and Ghāziābād had the worst PM2.5 levels, while Lima and Medellín were also among the 23.
Next, we identified the cities with the fewest safe air days in a full year — and found 23 cities that recorded no days with PM2.5 levels below 5 μg/m³ at all.
Of these, it was Delhi, India, that maintained the highest concentration of fine particulate matter across the year, at an average of 154.1 μg/m³. The U.S. Environmental Protection Agency (EPA) defines PM2.5 levels of 151 to 200 μg/m³ as “Unhealthy,” warning that “[s]ome members of the general public may experience health effects; members of sensitive groups may experience more serious health effects.”
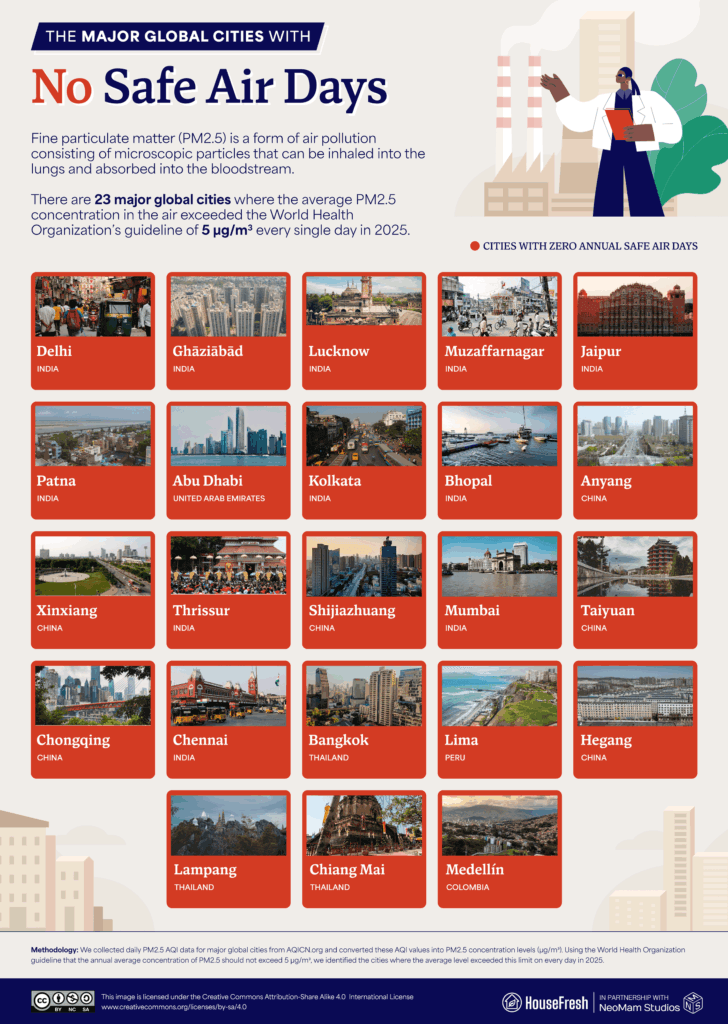
The Indian cities of Ghāziābād, Lucknow, and Muzaffarnagar all maintained PM2.5 levels exceeding 130 μg/m³.
Only two major cities outside of Asia recorded zero safe air days: Lima, Peru, which averaged 72.5 μg/m³ across 2025; and Medellín, Colombia, where the average was 54.4 μg/m³.
Honolulu has America’s most safe air days
Houston and Los Angeles record fewer than 100 safe air days each in a year.
Next, we checked the number of safe air days enjoyed by each of 48 major U.S. cities. Honolulu achieved over two weeks’ worth of safe air days more than the rest. Hawaii’s capital had 346 safe air days in a year, maintaining PM2.5 levels of 17.7 μg/m³ across the year. Albuquerque was the only other city to maintain more than 300 days of safe air, and the only other city with average PM2.5 levels below 20 μg/m³ (18.9 μg/m³).
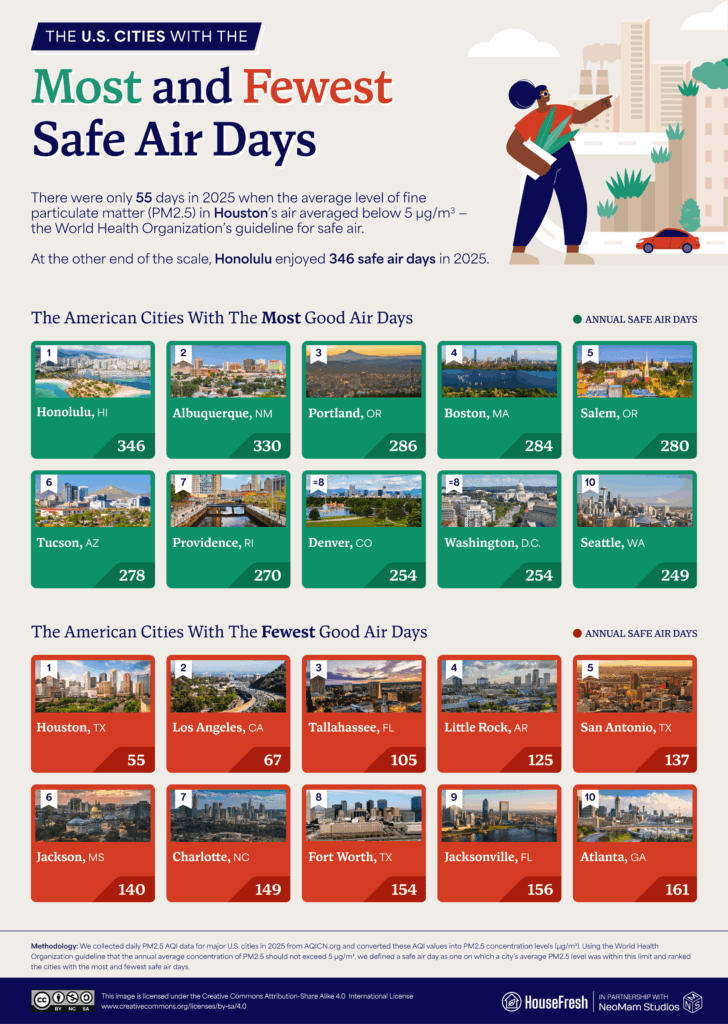
At the other extreme, only Houston (55 safe air days) and Los Angeles (67) had fewer than 100 days with PM2.5 levels below 5 μg/m³ in a year. The average PM2.5 levels in these cities were 41.8 μg/m³ and 44.7 μg/m³, respectively.
Portuguese coastal city has most safe air days in Europe
Spanish and Italian cities join Wrocław, Poland, among the cities where PM2.5 levels are worst.
With 343 safe air days in a year, the coastal city of Funchal, Portugal, had the fifth-highest number of safe air days of any global city and is number one in Europe.
The city maintained average PM2.5 levels of 16.0 μg/m³ across the year, which was matched by Tampere, Finland — although Tampere only managed a still respectable 323 safe air days.
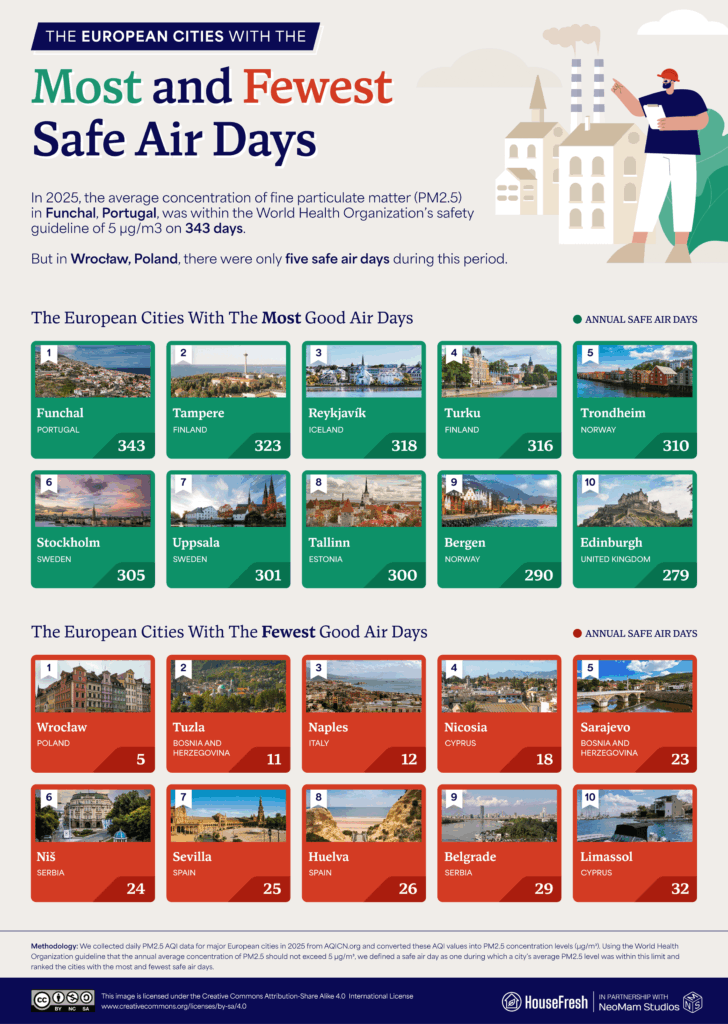
The European cities with the fewest safe air days are mostly in Eastern and Southeastern Europe, with Wrocław, Poland, achieving just five days of fine particulate matter below 5 μg/m³ in a year. Tuzla, Bosnia and Herzegovina, had 11 safe air days, but the average PM2.5 level in 2025 was 36% higher than in Wrocław, at 81.2 μg/m³.
Further west, Naples, Italy, achieved just 12 safe air days. The Spanish cities of Sevilla and Huelva are also among the bottom 10, with average PM2.5 levels around the EPA’s “Moderate” grade — indicating “there may be a risk for some people, particularly those who are unusually sensitive to air pollution.”
How many safe air days are there in the cities near you?
Use our interactive table to check the number of low-PM2.5 days in 433 global cities.
You can use the search and sort options to compare the number of days with PM2.5 levels below 5 μg/m³ in major cities all around the world.
You can check the air quality levels near you right now and for the days ahead using the government’s AirNow website, which measures five different pollutants, including fine particulate matter (PM2.5).
When the AQI is over 300, it is important to stay inside; with AQI levels over 50, it is worth tailoring your activities to the conditions, whether that means reducing or relocating outdoor exercise, wearing a mask or getting out of town altogether. The effects of poor air quality can be more severe at lower levels for those with pre-existing respiratory conditions.
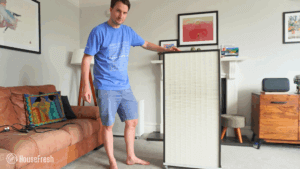
If you live in an area where bad air or wildfires are a particular issue, consider buying or building an air purifier. Visit this page to learn more about air purifiers and find the best ones we’ve tested.
To identify the cities with the most and fewest safe air days, we analyzed daily PM2.5 air pollution data for 2025 from the AQICN database.
First, we collected daily PM2.5 AQI data for cities worldwide from AQICN.org. AQI values are index scores rather than direct pollution measurements, so we converted the PM2.5 AQI values into PM2.5 concentration levels (μg/m³) using the methodology and breakpoint calculations employed by the U.S. Environmental Protection Agency’s AirNow AQI Calculator.
Next, we calculated the number of “safe air days” for each city during 2025. World Health Organization guidelines state that annual average concentrations of PM2.5 should not exceed 5 µg/m3, so we defined a safe air day as one with a PM2.5 concentration below 5.0 μg/m³.
For cities with fewer than 365 days of PM2.5 data, we calculated the number of safe air days as a proportion of days with available data so as to ensure comparability between all cities. Estimated good air days per year were calculated as follows:
Estimated good air days per year = (Number of safe air days ÷ Total days with PM2.5 data) × 365
We filtered out cities with fewer than 300 days of AQI data in 2025 and ranked the remaining cities based on their estimated number of safe air days per year. In the case of ties, we used the cities’ annual average PM2.5 as an additional ranking factor.
The final dataset included 433 cities across 60 countries. Data was collected in June 2026 and reflects PM2.5 observations recorded during the 2025 calendar year.