According to the World Health Organisation, in 2022, 99% of the world’s population is breathing polluted air. It’s not a new issue, either: air pollution and its health effects have been on humanity’s radar for thousands of years. But while the phrase ‘air pollution’ might conjure up images of thick smog and eye-watering smoke, the most harmful type of air pollution particles are invisible to the naked eye.
Particulate matter 2.5 (PM2.5) describes pollutant particles so small that they can pass into your bloodstream and cause a range of health problems. In fact, they’re responsible for the deaths of around 4.2 million people worldwide each year. As it won’t disappear completely anytime soon, the WHO wants to reduce average annual levels to no more than five micrograms per cubic meter of air (µg/m3).
Much of the world still has a long way to go in reducing harmful air pollution levels, but the good news is that some cities are making great strides toward cleaning up the air. With this in mind, our researchers at HouseFresh wondered: based on changing local levels of PM2.5, where in the world has air pollution improved — or worsened — the most in recent years?
For each of the 480 global cities in our analysis, we calculated the average air pollution level of the first nine months of 2019 and 2022 (measured in PM2.5 micrograms per cubic meter of air, or µg/m3). We then worked out the value difference between 2019 and 2022 to discover the cities where air pollution levels had increased or decreased the most.
Key findings
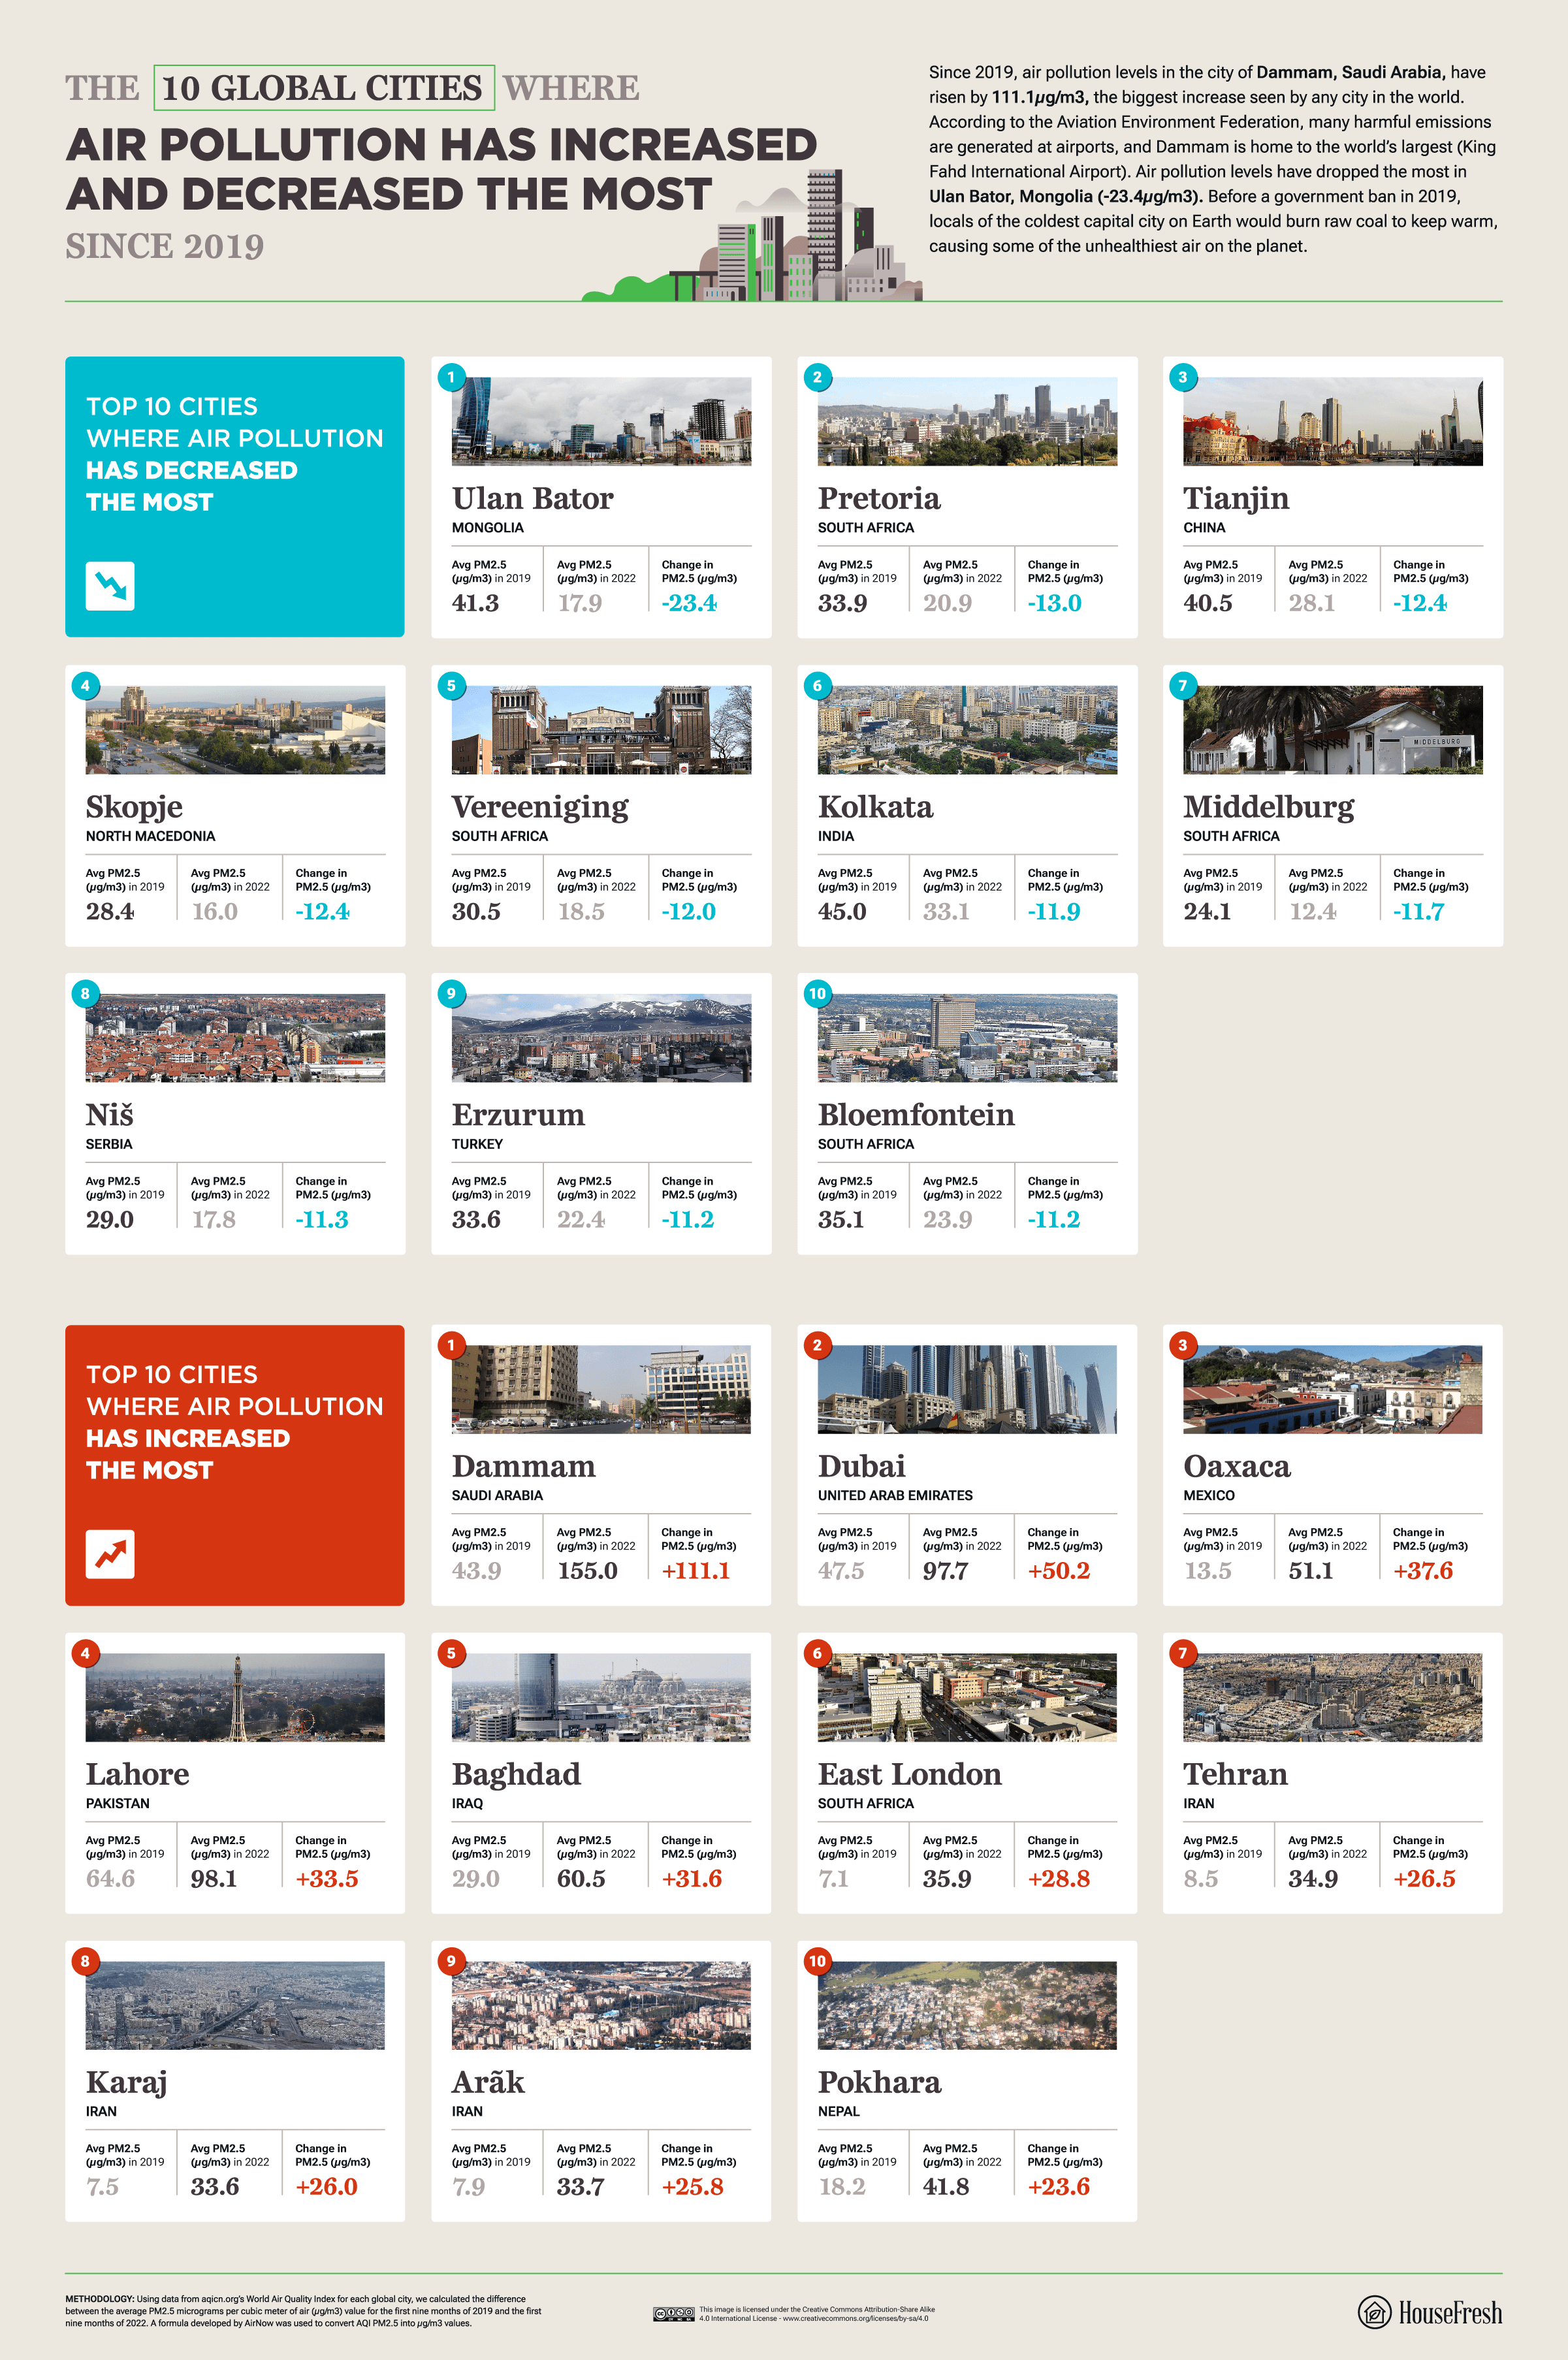
- Out of 480 global cities, Dammam in Saudi Arabia has seen air pollution levels increase the most (+111.1µg/m3).
- Ulan Bator, Mongolia, has seen air pollution levels decrease the most (-23.4µg/m3).
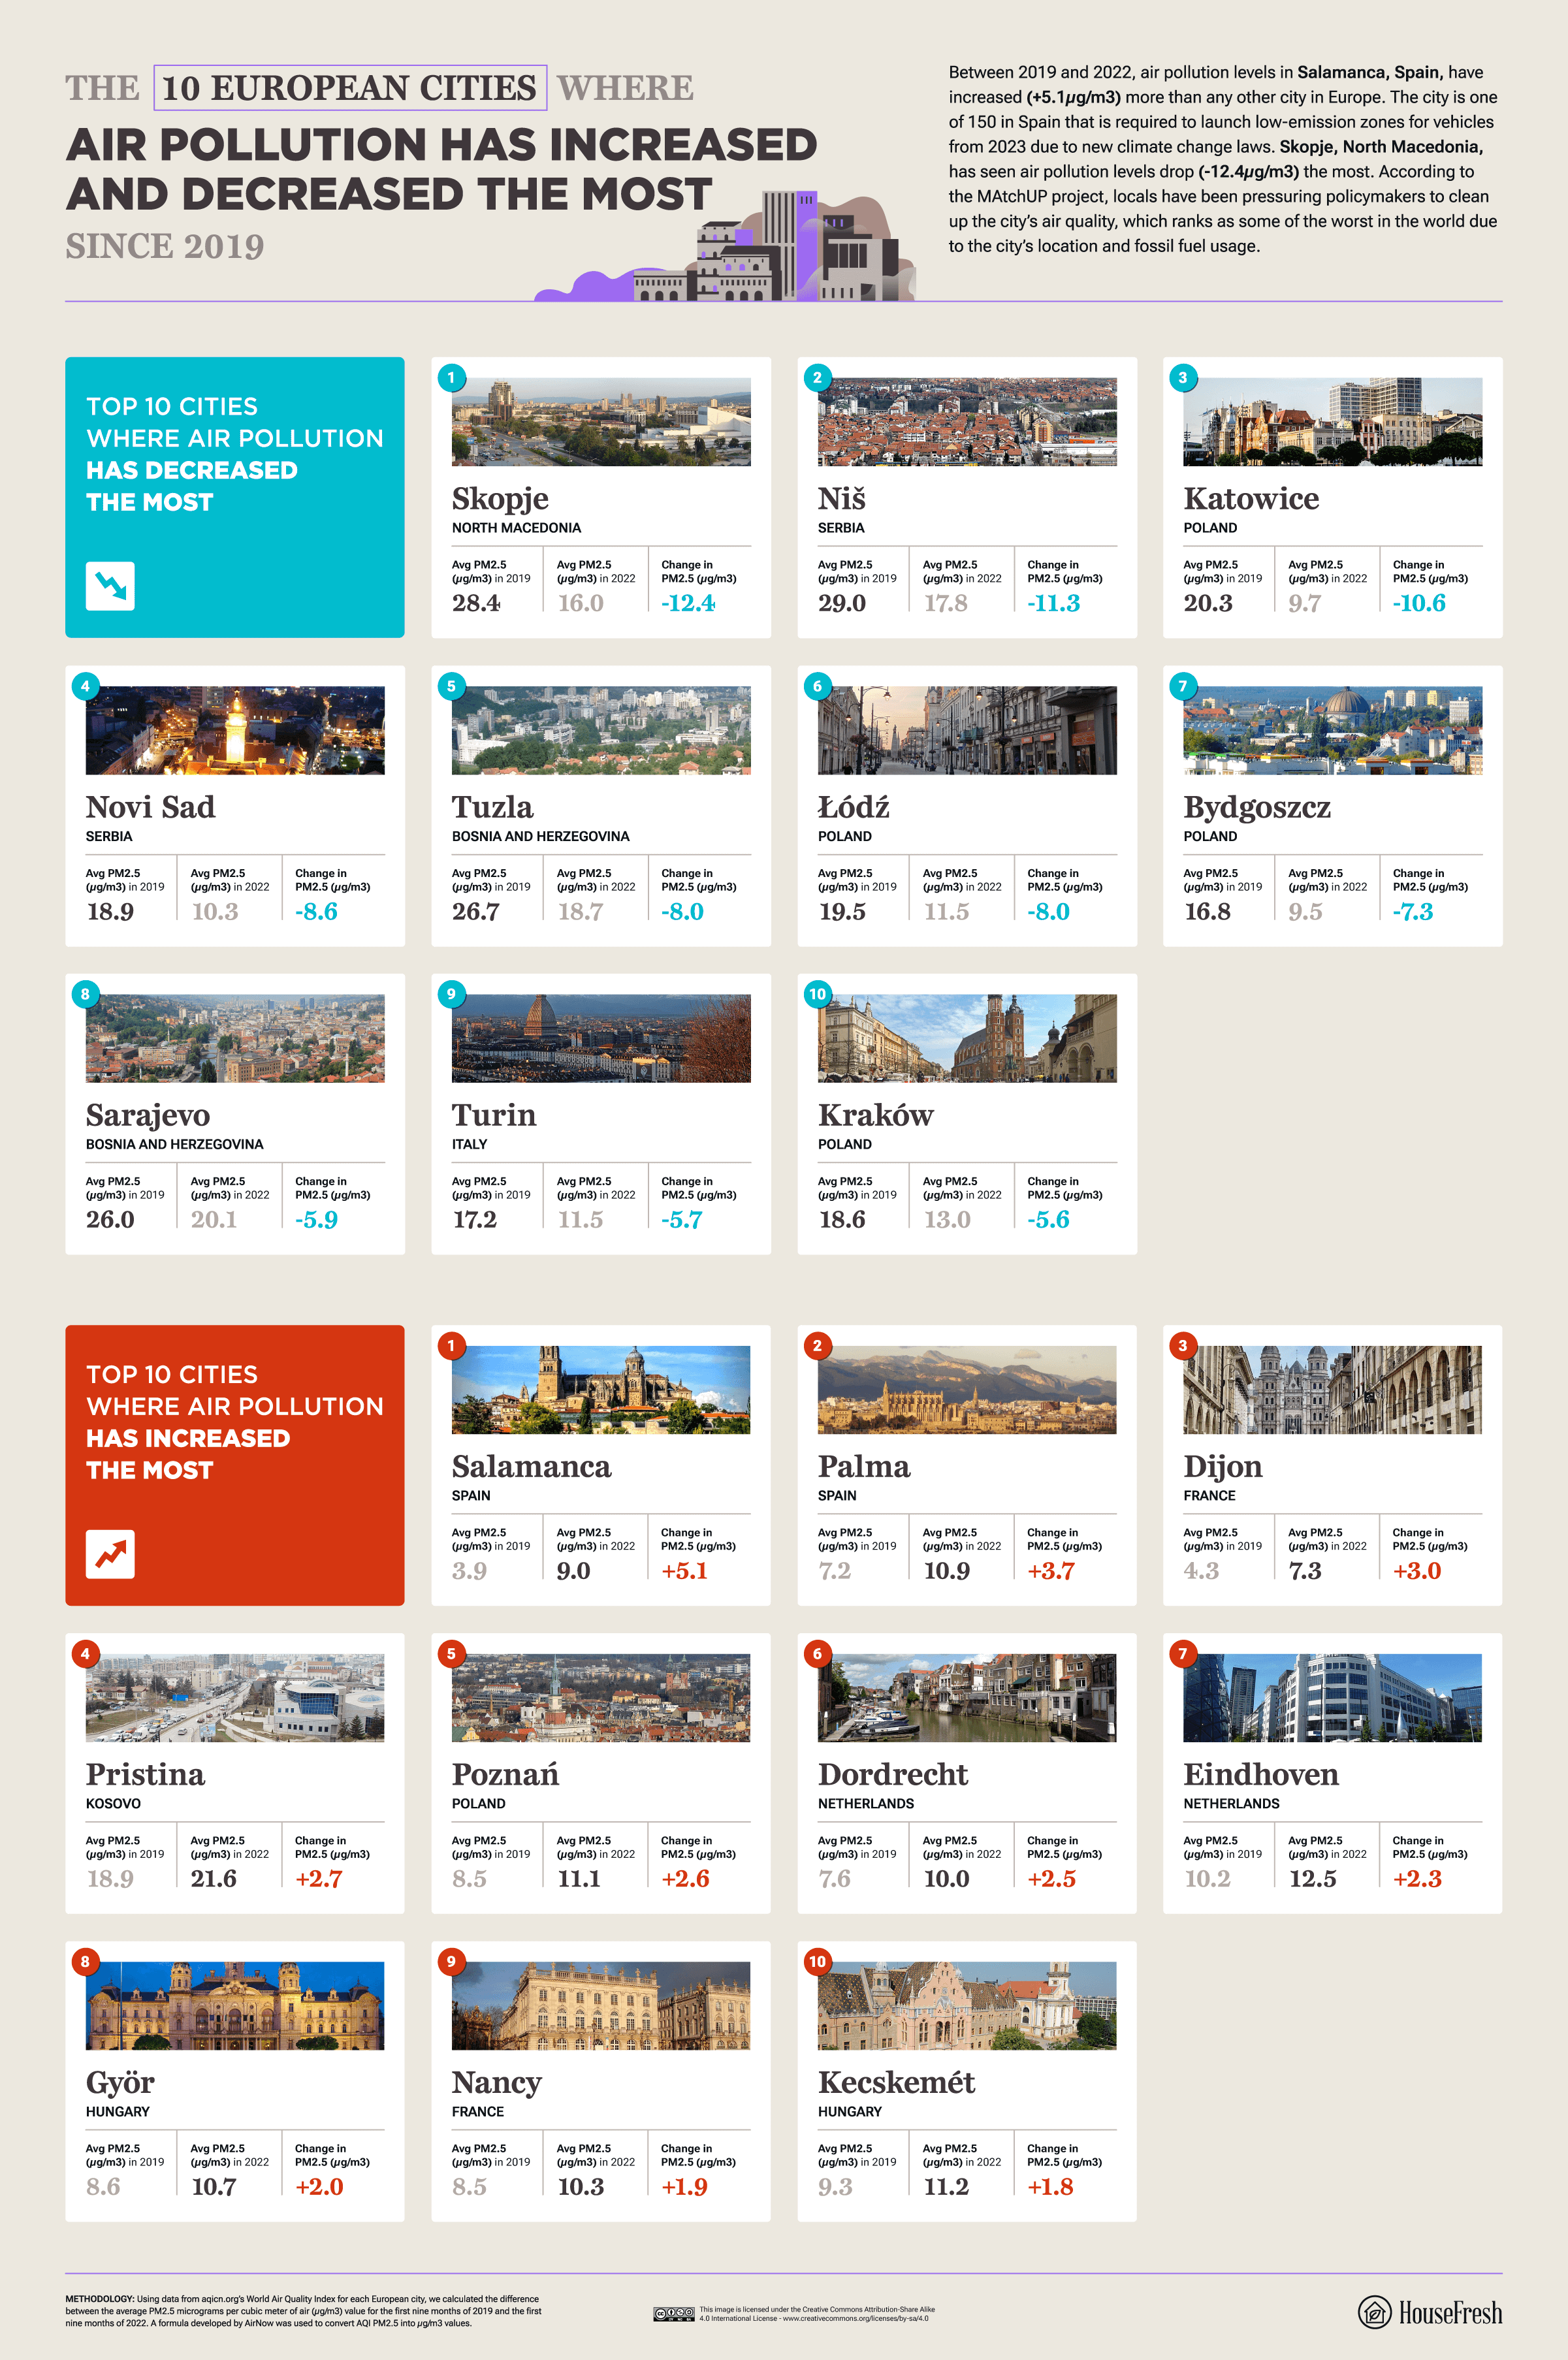
- In Europe, Salamanca, Spain, saw air pollution levels rise the most (+5.1µg/m3), while levels in Skopje, North Macedonia, have dropped the most (-12.4µg/m3).
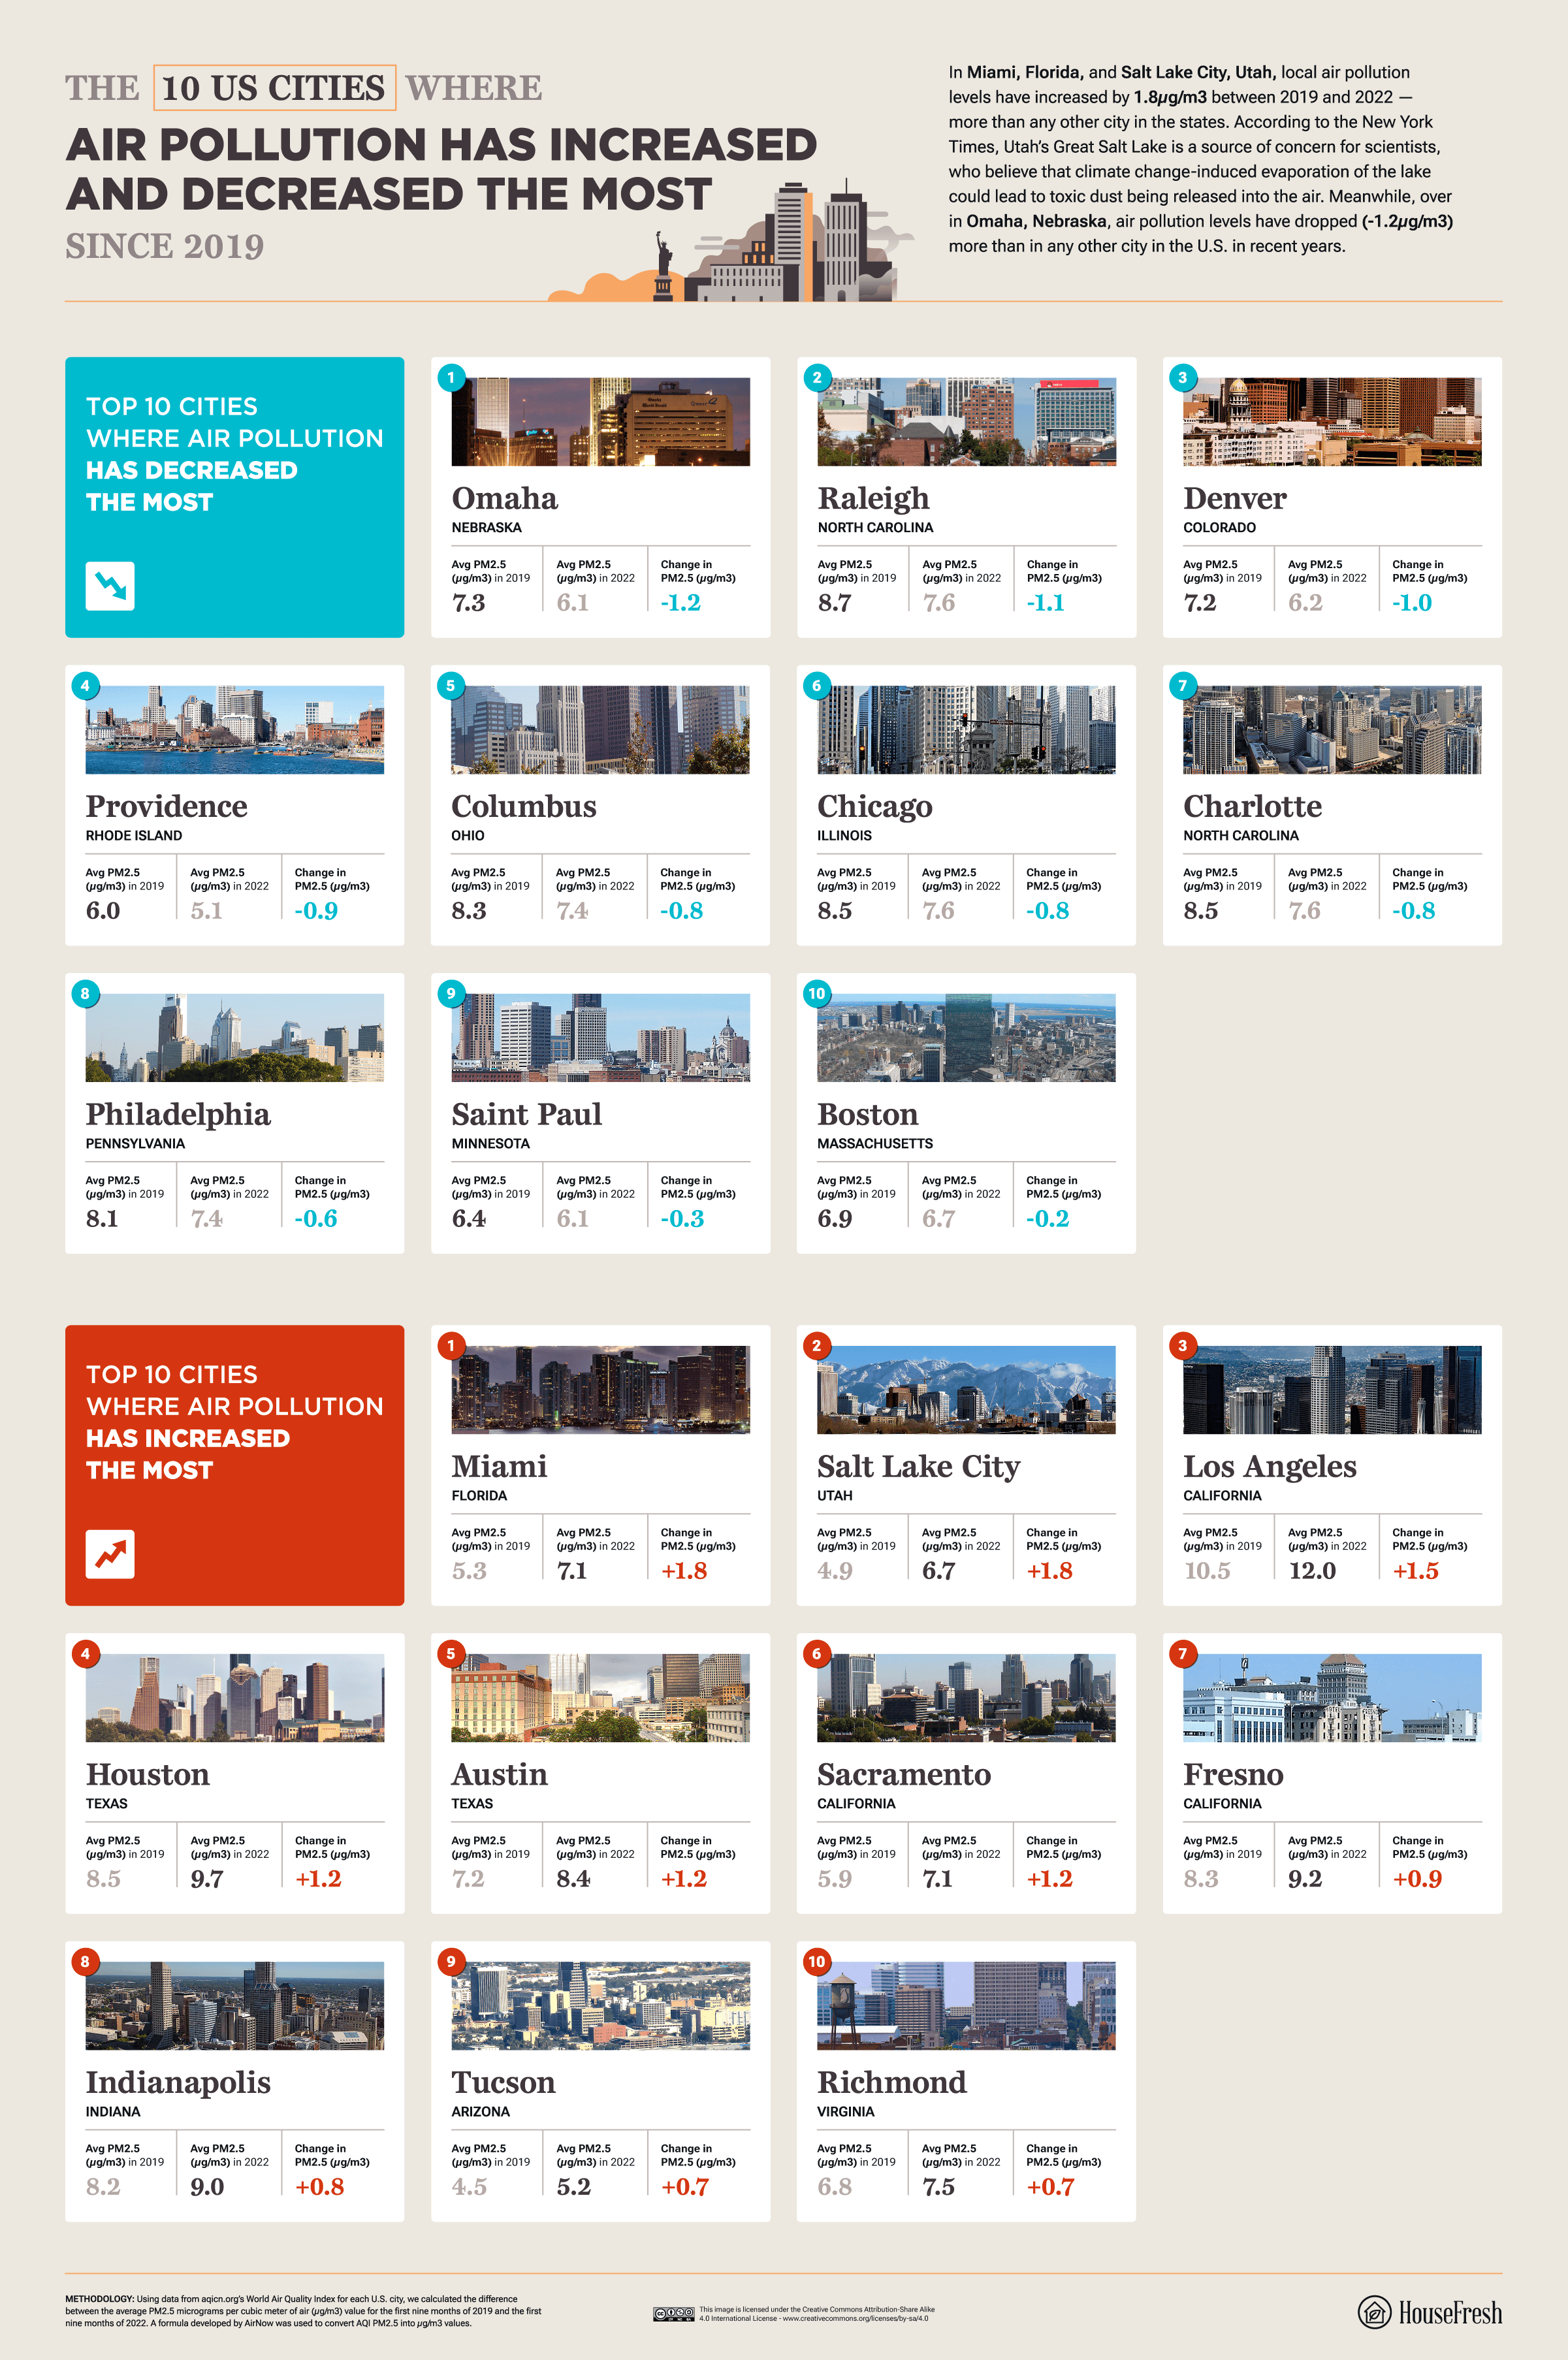
- In the U.S., Miami (FL) and Salt Lake City (UT) saw air pollution increase the most (+1.8µg/m3), and Omaha (NE) saw the biggest decrease (-1.2µg/m3).
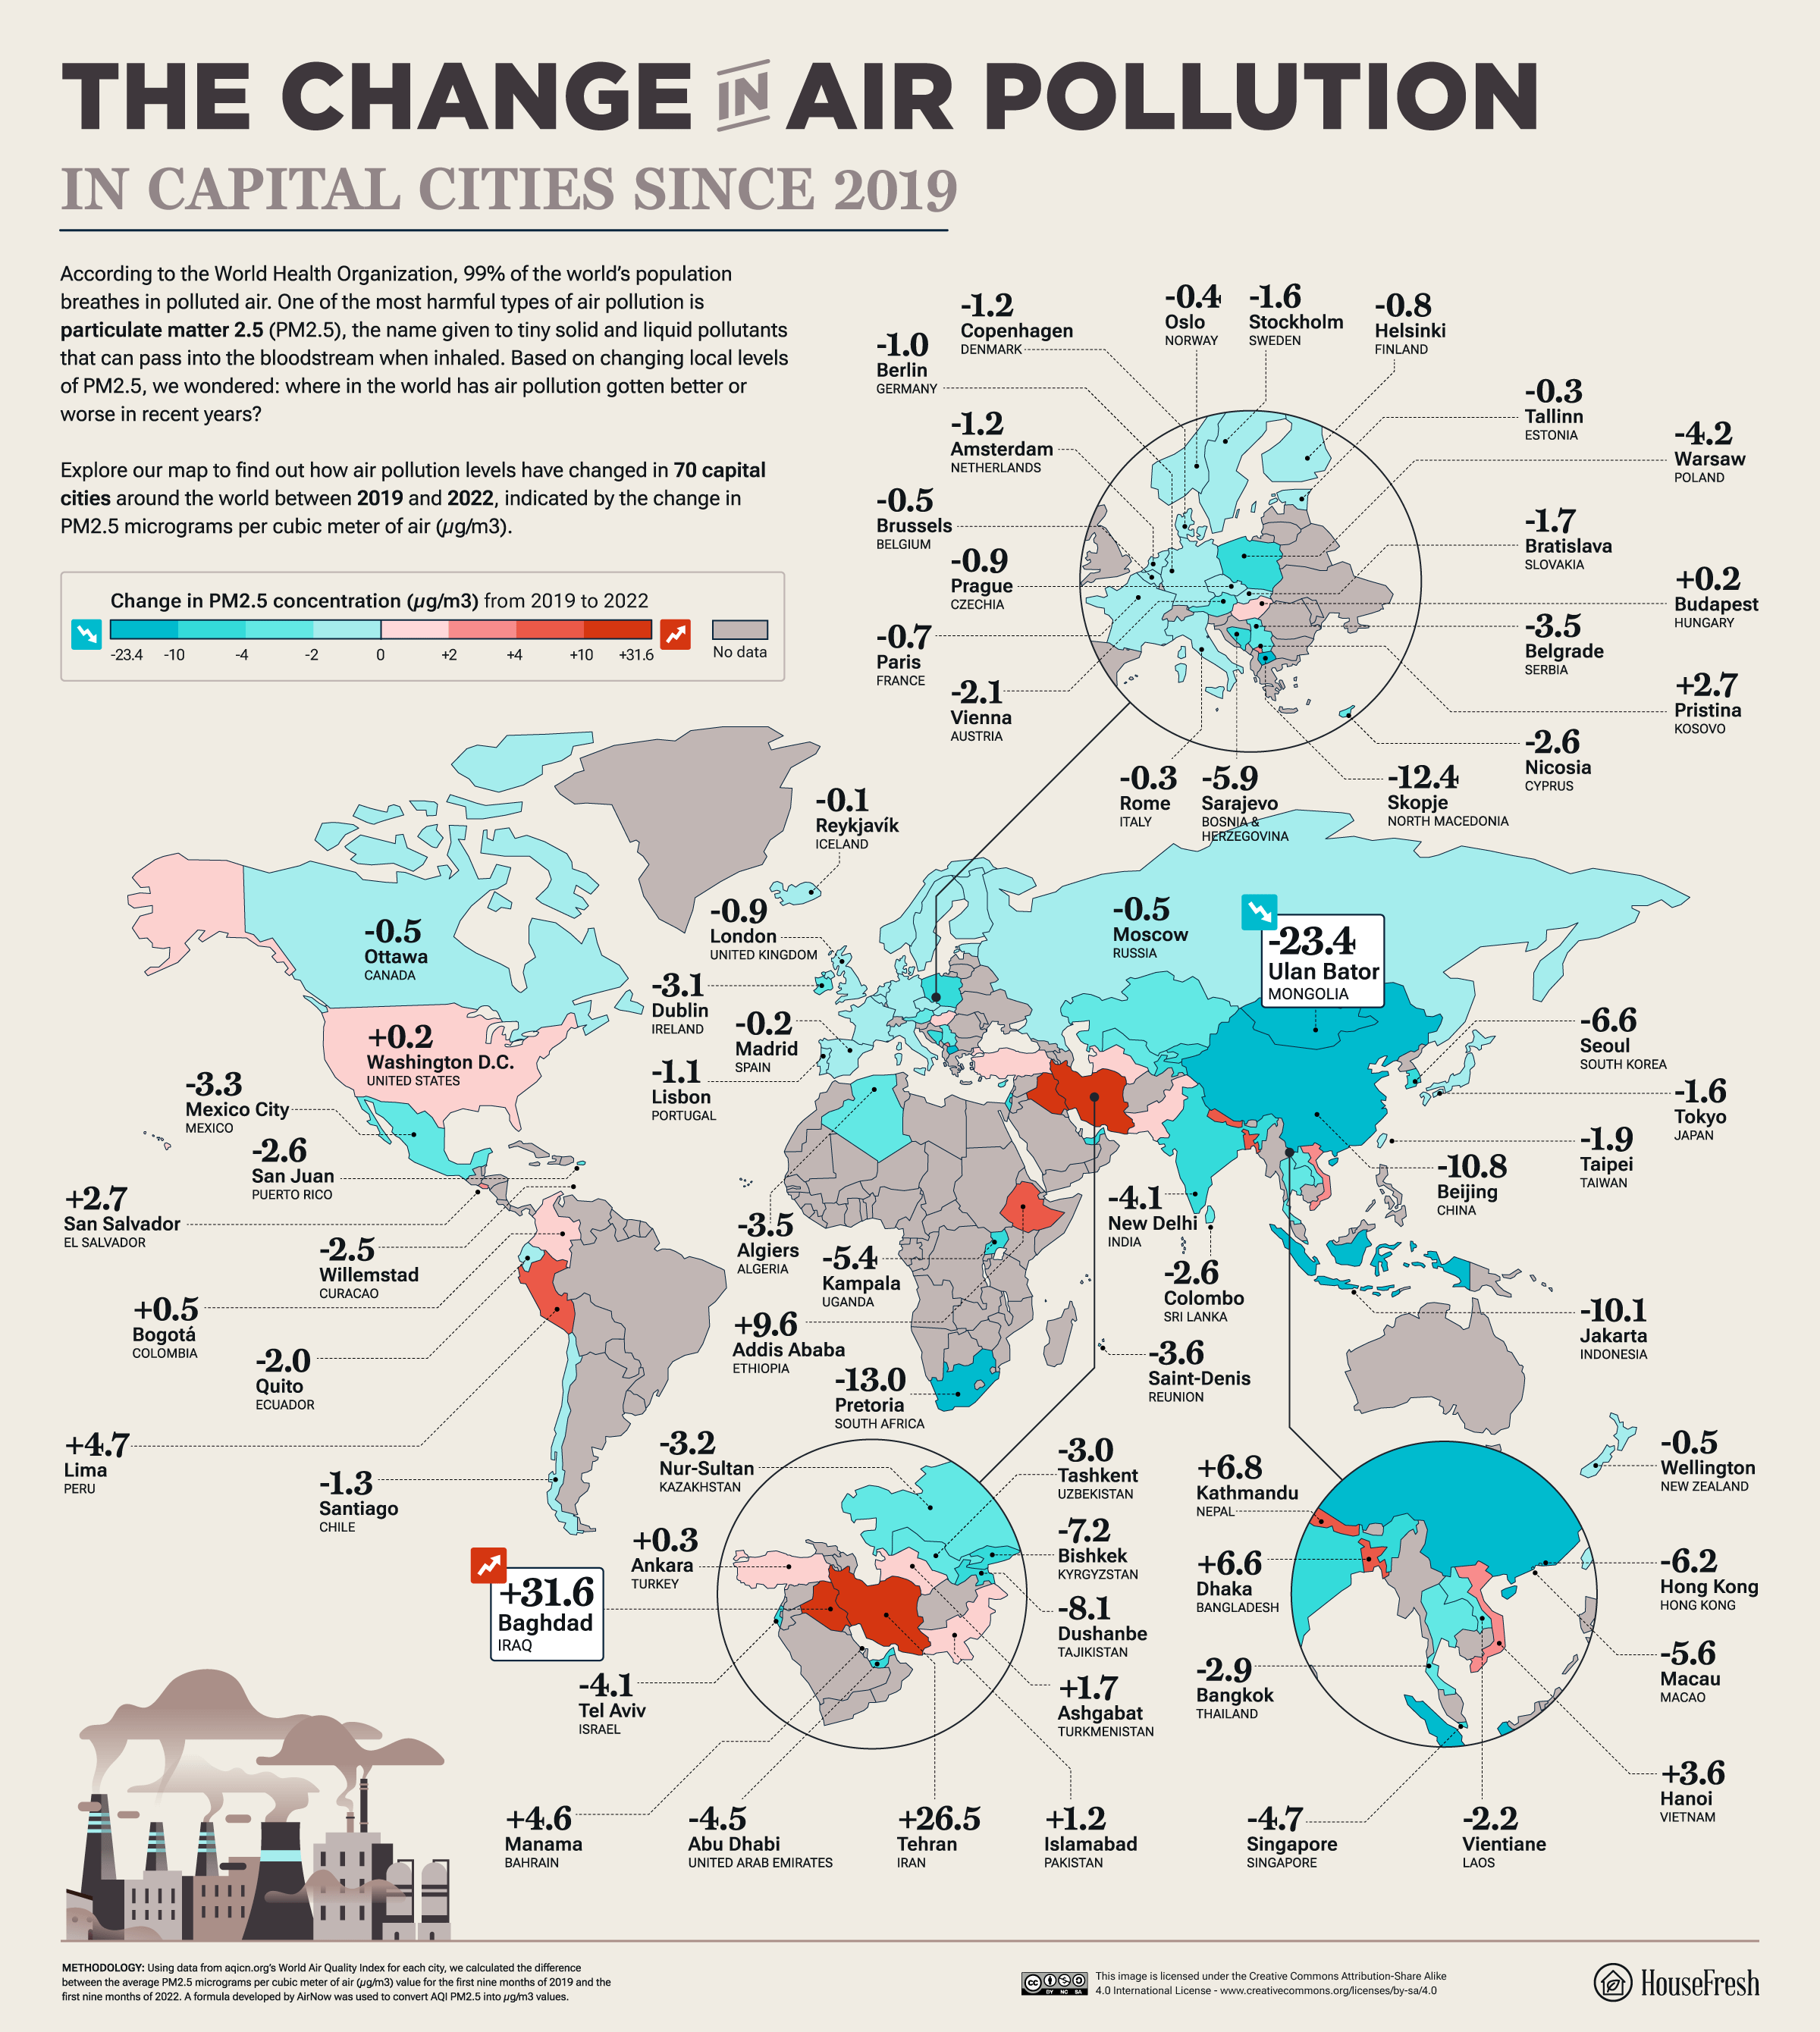
Which capital cities have seen the biggest change in air pollution levels?
Generated primarily by burning oil and wood, PM2.5 — also known as fine particles — is the most unhealthy type of particulate matter (particles of pollution suspended in the air) to breathe in.
While the WHO has made clear that even very low levels of PM2.5 can cause harm to someone’s health, its new guideline for average annual concentrations is five micrograms per cubic meter of air (µg/m3). In other words, any location with an average annual PM2.5 level higher than that is considered to have unhealthier air. For example, the average annual concentration of PM2.5 in Beijing, China, was 40.54µg/m3 in 2021 — much higher than the WHO guideline.
To find out how air pollution is changing in 70 capital cities around the world, we calculated the difference between local levels of PM2.5 in the air in 2019 and 2022. Explore our map to view our results.

Of all capital cities, Baghdad, Iraq, has seen the most drastic rise (+31.6µg/m3) in PM2.5 levels since 2019. One 2015 study found that 81% of PM2.5 from the city is “dominated by dust, sulfate, gasoline and diesel.” The biggest change for the better can be found in Ulan Bator, the capital of Mongolia, where PM2.5 levels have dropped by 23.4µg/m3.
Dammam, Saudi Arabia, has seen air pollution increase more than in any other city
Our data reveals the top 10 global cities where air pollution levels have increased the most since 2019. Claiming the unfortunate top spot is Dammam, Saudi Arabia, where local PM2.5 levels have risen by 111.1µg/m3 — more than any other city on the planet. Dammam is a significant center for the Saudi oil industry and is home to both the largest port in the Persian Gulf and the largest airport in the world. One study labels airports as “hotspots” for harmful PM2.5 air pollution.

Other cities have seen air pollution levels drop since 2019, none more so than Ulan Bator, Mongolia (-23.4µg/m3), previously declared one of the most polluted capitals on Earth. Multiple factors contributed to the city’s dangerously unhealthy air: not only is Ulan Bator situated in a valley that traps air pollution, but in the past, locals burned raw coal, plastic and rubber tires to tackle the extreme cold. Fortunately, a plan to improve air quality was launched in 2017, including a ban on burning raw coal.
In Europe, air pollution levels have dropped the most in Skopje, North Macedonia
Our analysis of changing air pollution levels in European cities reveals that Salamanca, Spain, has seen PM2.5 levels increase the most (+5.1µg/m3) since 2019. Another Spanish city, Palma, comes second (+3.7µg/m3). According to IQAir, vehicles are the main source of pollution in the country’s urban areas. On the plus side, both cities are required to introduce low-emission zones for vehicles from 2023 as part of Spain’s plan to reach climate neutrality by 2050.

Skopje, the capital of North Macedonia, was once the most polluted capital city in Europe due to emissions from local industry, outdated cars and residents burning wood and plastic to keep warm. The good news is that local levels of PM2.5 have dropped (-12.4µg/m3) more than in any other European city since 2019. In recent years, concerned locals have been campaigning for better air quality, and the city’s Green City Action Plan has prioritized improving the air.
Air quality in Miami and Salt Lake City has worsened more than any other U.S. city
In the U.S., our analysis reveals that air pollution has increased the most in Miami, Florida, and Salt Lake City, Utah: in both cities, PM2.5 levels have risen by 1.8µg/m3 since 2019. Salt Lake City, in particular, is at a natural disadvantage when it comes to poor air quality: situated in a valley, the city is prone to a meteorological effect known as inversion, which is when the cooler air of the city is trapped underneath the warmer air above it, keeping pollution close to ground level.

The situation is brighter in Omaha, Nebraska, where air pollution levels have decreased by 1.2µg/m3 since 2019 — more than any other city in the U.S. Raleigh in North Carolina has seen the next biggest drop in air pollution (-1.1µg/m3). In 2022, the Governor of North Carolina issued an executive order to increase the number of sales of zero-emission trucks and buses. According to the Environmental Defense Fund, transportation is one of the most polluting sectors in the state.
The cities where air pollution has increased and decreased the most since 2019
From one city to the next, air pollution levels can vary drastically. To find out how air pollution levels have changed since 2019 in a city of your choice, explore our interactive table below.
It’s only natural to be concerned about high levels of air pollution where you live. Fortunately, there are steps you can take to look after your health. If you’re in the U.S., you can use AirNow to find out what your local area’s Air Quality Index score is and follow their guidance depending on the result. This might mean limiting time outside on days with particularly high levels of air pollution.
On a wider scale, making small changes to your daily life can help lower the level of harmful particulate matter in the air. For example, you might want to consider using public transportation, and if you do need to use your car, make sure you don’t leave it idling. If you want to make a bigger change, the American Lung Association has more information on taking part in their Healthy Air Campaign.
METHODOLOGY
Using data from aqicn.org’s World Air Quality Index for each city, we calculated the difference between the average PM2.5 micrograms per cubic meter of air (µg/m3) value for the first nine months of 2019 and the first nine months of 2022. A formula developed by AirNow was used to convert AQI PM2.5 into µg/m3 values.
The original data for New York City is split into its constituent boroughs, so we used the average value of pollution levels across all boroughs. Cities in Ukraine were excluded from the comparison due to the ongoing military conflict having an inevitable impact on the level of air pollution. The data was collected in October 2022.


