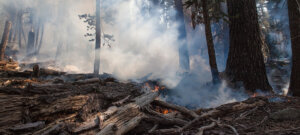
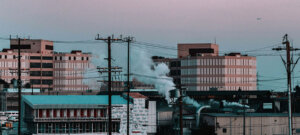
Towns and cities are hotspots for air pollution from transport emissions and tire wear, domestic and industrial fossil fuel combustion and other sources. Not only do urban areas generate more pollution, but their very shape makes it worse: the urban heat island effect catalyzes the release of additional chemical fumes, while rows of tall buildings restrict the outward flow of polluted air.
And urban air pollution isn’t just an issue for local inhabitants. Bad air travels. For instance, London emits over 6,000 tonnes of PM2.5 (fine particulate matter) and 51,000 tonnes of NO2 annually, which has a detrimental effect on much of the southeast of England. In Delhi, over half of the particulate matter in the air is from nearby states and countries; the same is true of many rural areas in India.
Over four billion people live in cities, and experts predict that this figure will double by 2050. Yet, many areas — particularly in the developing world — lack robust air monitoring systems. Meanwhile, even in areas where air quality data is available, governments are slow or resistant to improving conditions for their citizens.
Change is both necessary and possible. Cities, including New York and Beijing, have reduced local air pollution by over 50% by introducing cleaner public transit vehicles and congestion charging, modernizing heating systems, and regulating emissions, among other solutions.
To find where this work is needed most, we analyzed 2024 data on the average PM2.5 level in every large town and city in the world.
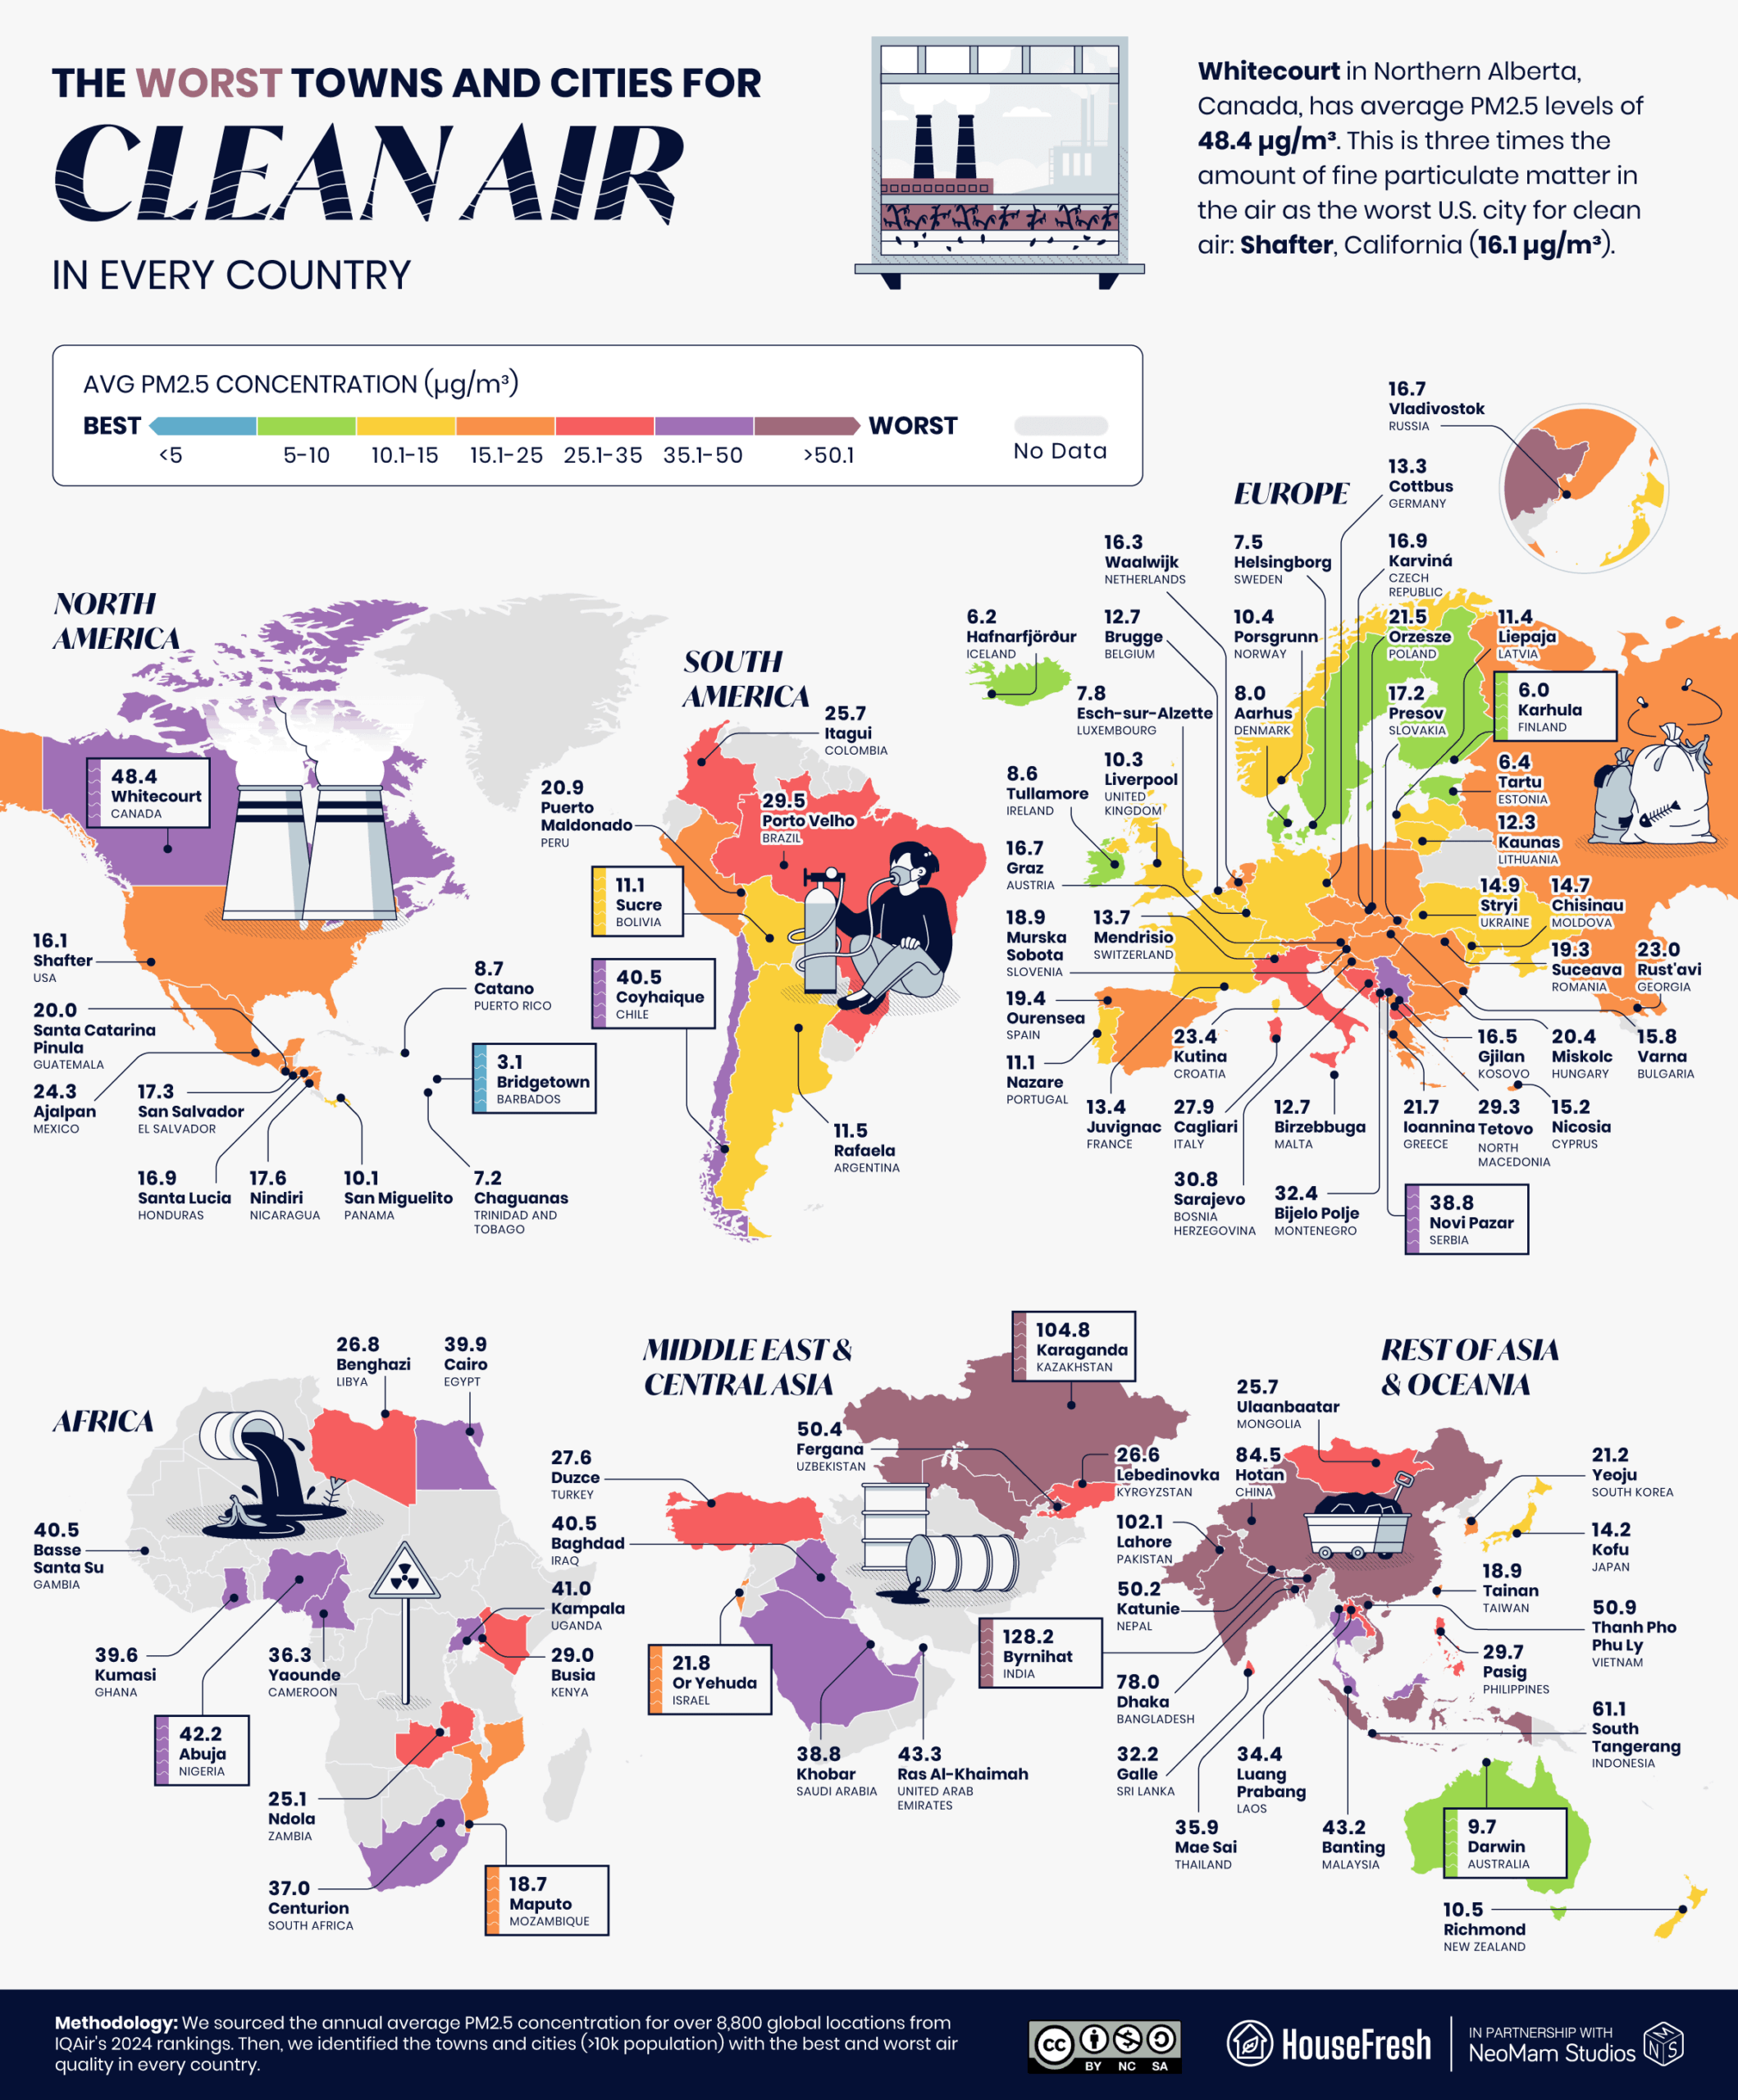
First, we sourced the annual average PM2.5 concentration for over 8,800 global locations from IQAir’s 2024 rankings. Then, we identified the towns and cities (above 10k population) with the best and worst air quality in every country and continent.
Key findings
- Overall, most of the countries with the cleanest air are in Europe and those with the most polluted cities are in Asia.
- Byrnihat in India has the worst air in the world, with an average PM2.5 concentration of 128.2 µg/m³ throughout 2024.
- America’s clean air capital is Waimea in Hawaii, with an annual PM2.5 concentration of 1.7 µg/m³.
- The worst place in America for clean air is Shafter, California, where 2024 data shows an average PM2.5 level of 16.1 µg/m³.
- Nassau in the Bahamas is the capital city with the cleanest air in the world (2.3 µg/m³) and N’Djamena in Chad is the most polluted capital (91.8 µg/m³).
- North America’s worst large towns and cities for clean air are almost all in Mexico, and Chile’s cities are among South America’s most polluted.
- Europe’s most polluted towns and cities are all on the Balkan Peninsula, with Novi Pazar in Serbia taking the title as the European place with the most polluted air (38.8 µg/m³).
- Pemba, Mozambique, is Africa’s best city for clean air, with average fine particulate matter levels of 6 µg/m³ in 2024. However, this concentration surpasses the maximum annual PM2.5 levels recommended by the WHO (5 µg/m³).
The place with the cleanest air in every country
Most of the countries with the cleanest cities are in Europe.
Half of the 20 cities with the cleanest air in the world are in Europe, of which Faro on Portugal’s south coast has the lowest average PM2.5 level (3 µg/m³). Five of these top 20 are in North America, with the U.S. number one — Waimea in Hawaii — the second cleanest ‘best city’ for clean air in the world (1.7 µg/m³). However, the town is vulnerable to the intrusion of vog (volcanic fog), which includes pollutants such as sulfur dioxide and hydrogen sulfide, as well as fine particulate matter.
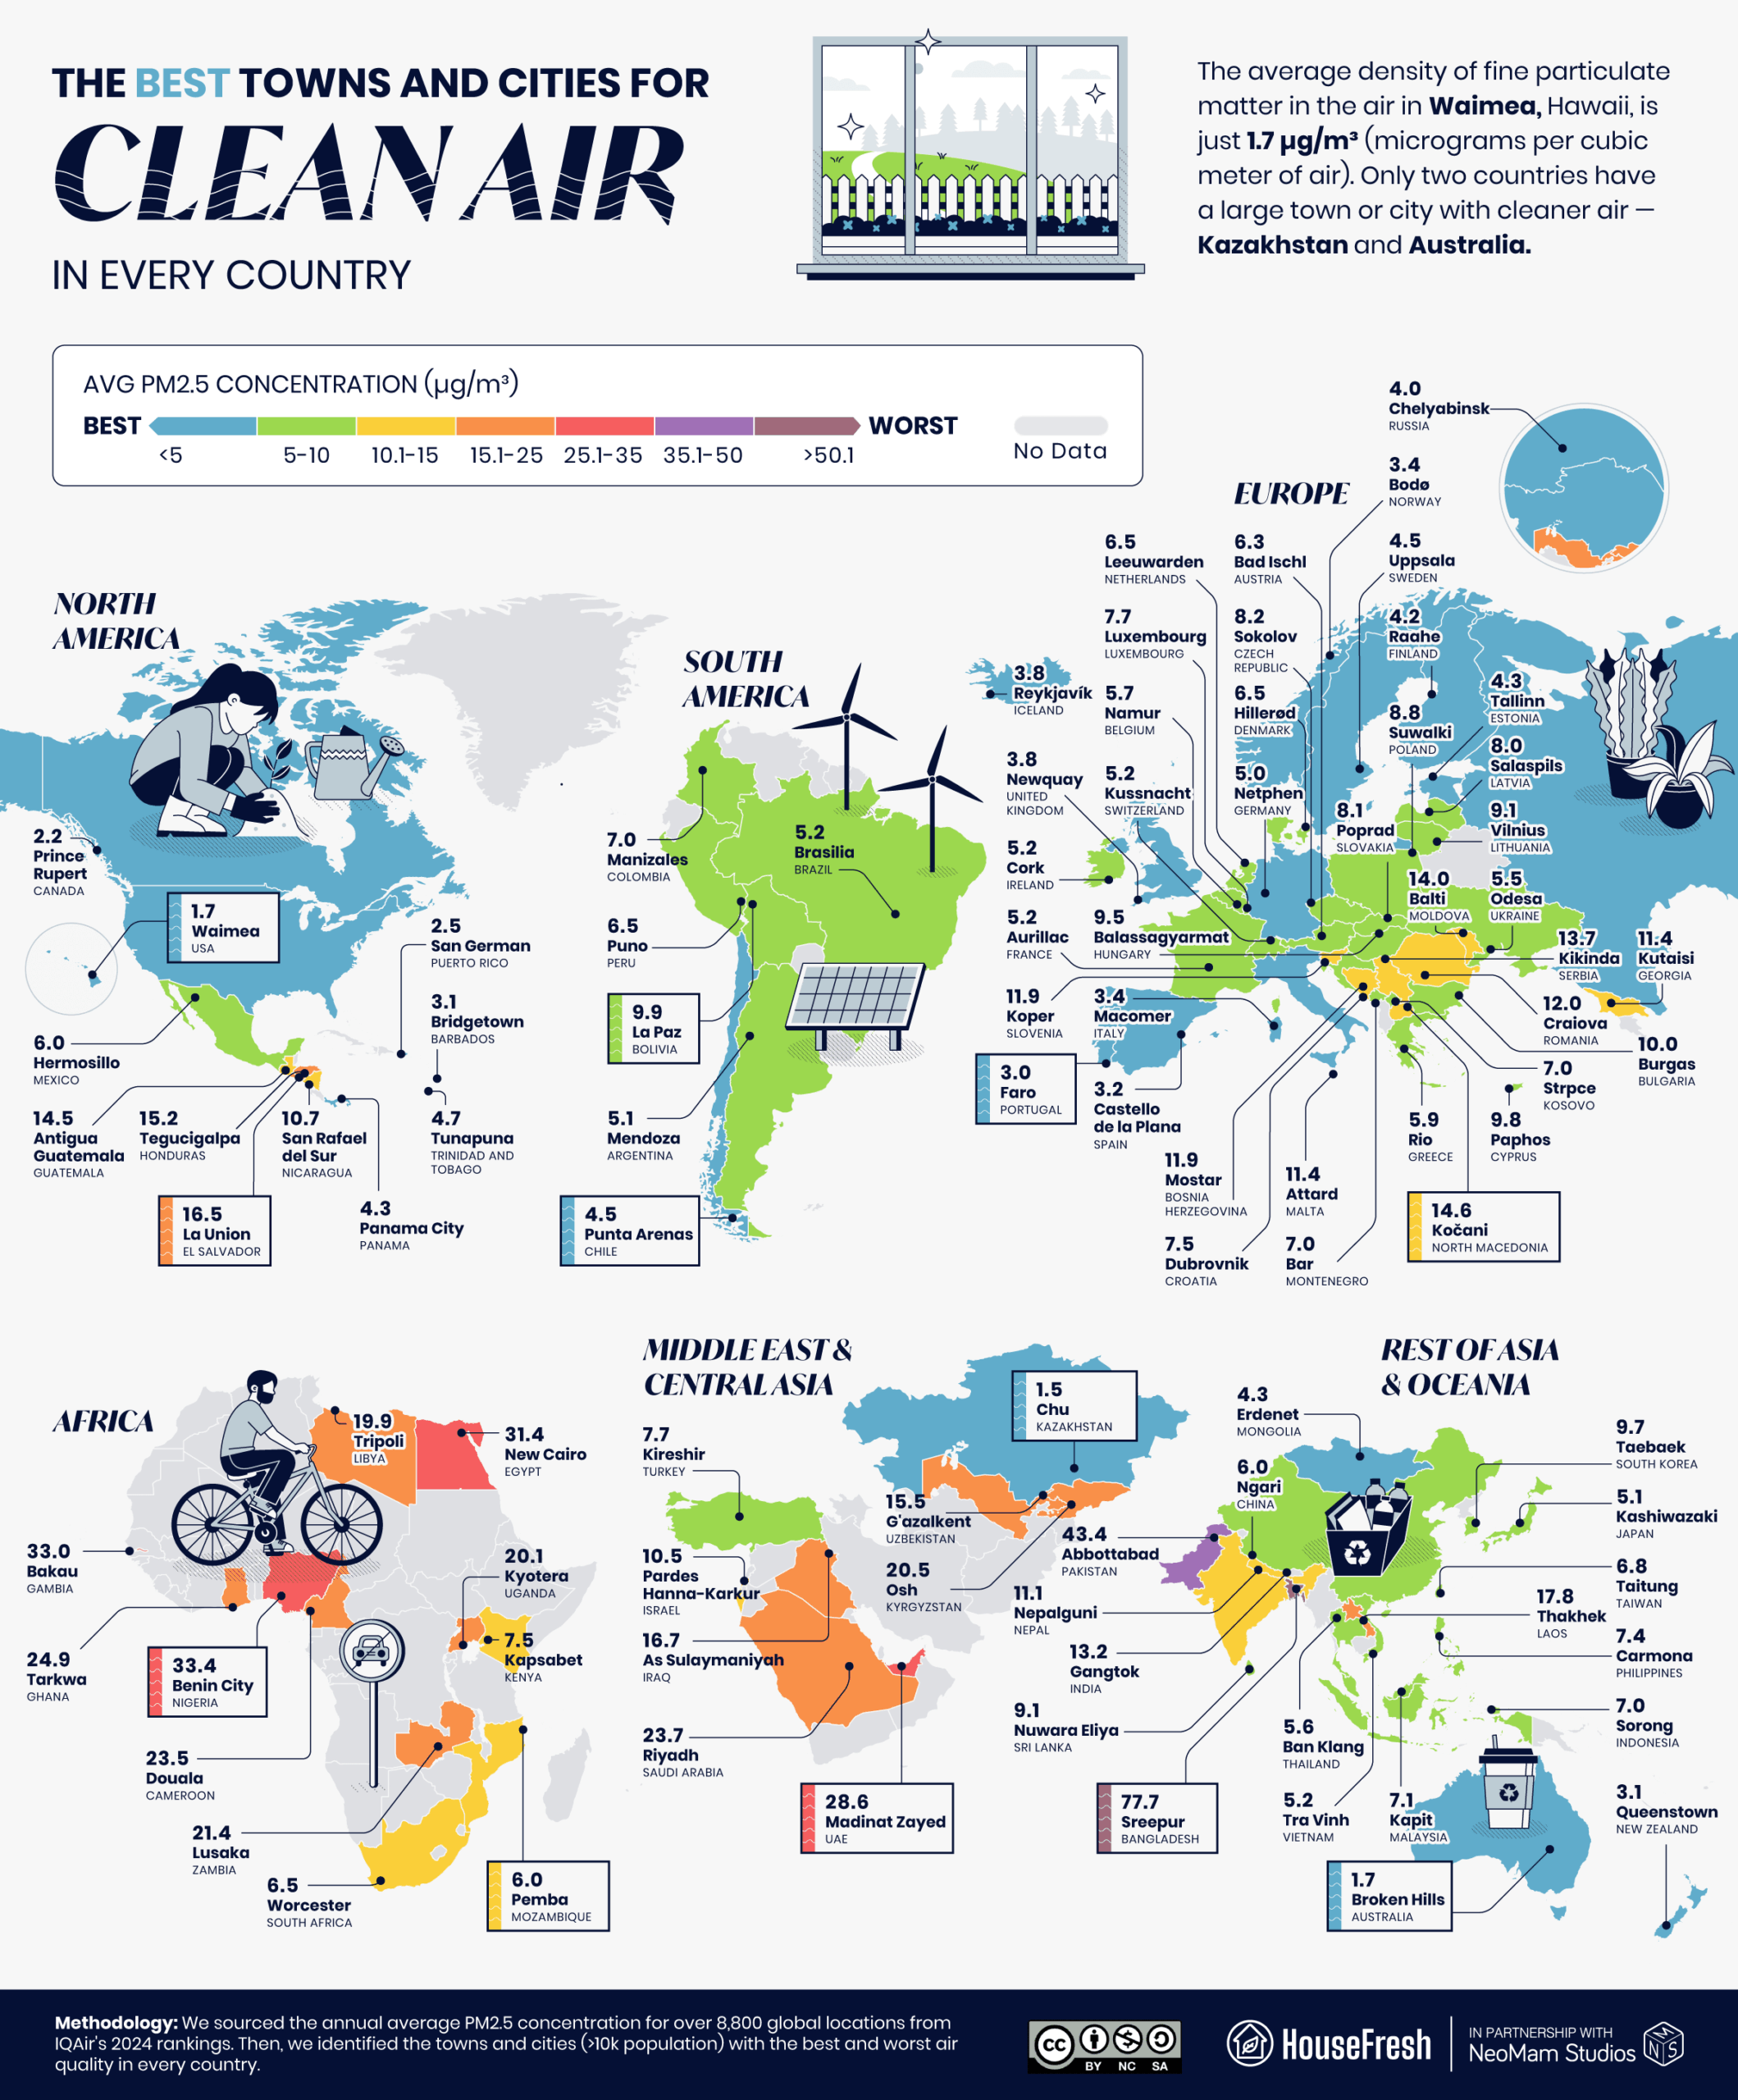
However, the best large town or city for clean air in our study is in Central Asia: Chu (also known as Shu) in Kazakhstan had an average air rating of 1.5 µg/m³ in 2024. Kazakhstan has pledged to become ‘climate neutral’ by 2060 but generally ranks among the world’s most polluted countries due to its massive and outdated industrial infrastructure. Dust storms can also be an issue in the south of the country.
The place with the most polluted air in every country
The majority of the countries with the most polluted cities are in Asia.
The nine countries with the most polluted places are all in Asia. IQAir’s 2024 World Air Quality report noted that South Asia’s air crisis is attributable to “industrial emissions, biomass burning, coal-fired power, and transportation.” Geographic conditions such as regional winds and the natural air barrier of the Himalayas compound the effect.
Byrnihat in India has the worst air in the world, at 128.2 µg/m³ (micrograms per cubic meter of air). “The topographical features, such as hills on both sides, blocked river channels and low-pressure zones which trap pollutants have all contributed to pollution here,” Devesh Walia, Dean of School of Human and Environmental Sciences at India’s North-Eastern Hill University, told Mongabay India. “Cement factories, coke factories, and distilleries are all located in a small area and along with environmental violations, pollution here is bound to rise.”
The best and worst capital cities for clean air
Nassau is the capital city with the clearest air, but N’Djamena and New Delhi have near-three-figure PM2.5 counts.
Next, we narrowed our findings down to capital cities. The ten capitals that are worst for clean air are all in Asia or Africa. There is little difference between N’Djamena in Chad (91.8 µg/m³) and New Delhi, India (91.6 µg/m³).
Those in poorer parts of N’Djamena are particularly vulnerable as these neighborhoods tend to be closer to the industrial zones. Chad repeatedly ranks as the world’s most air-polluted country and now has a National Poverty Reduction Strategy in place to move to clean energy and tighter regulation of industrial polluters.
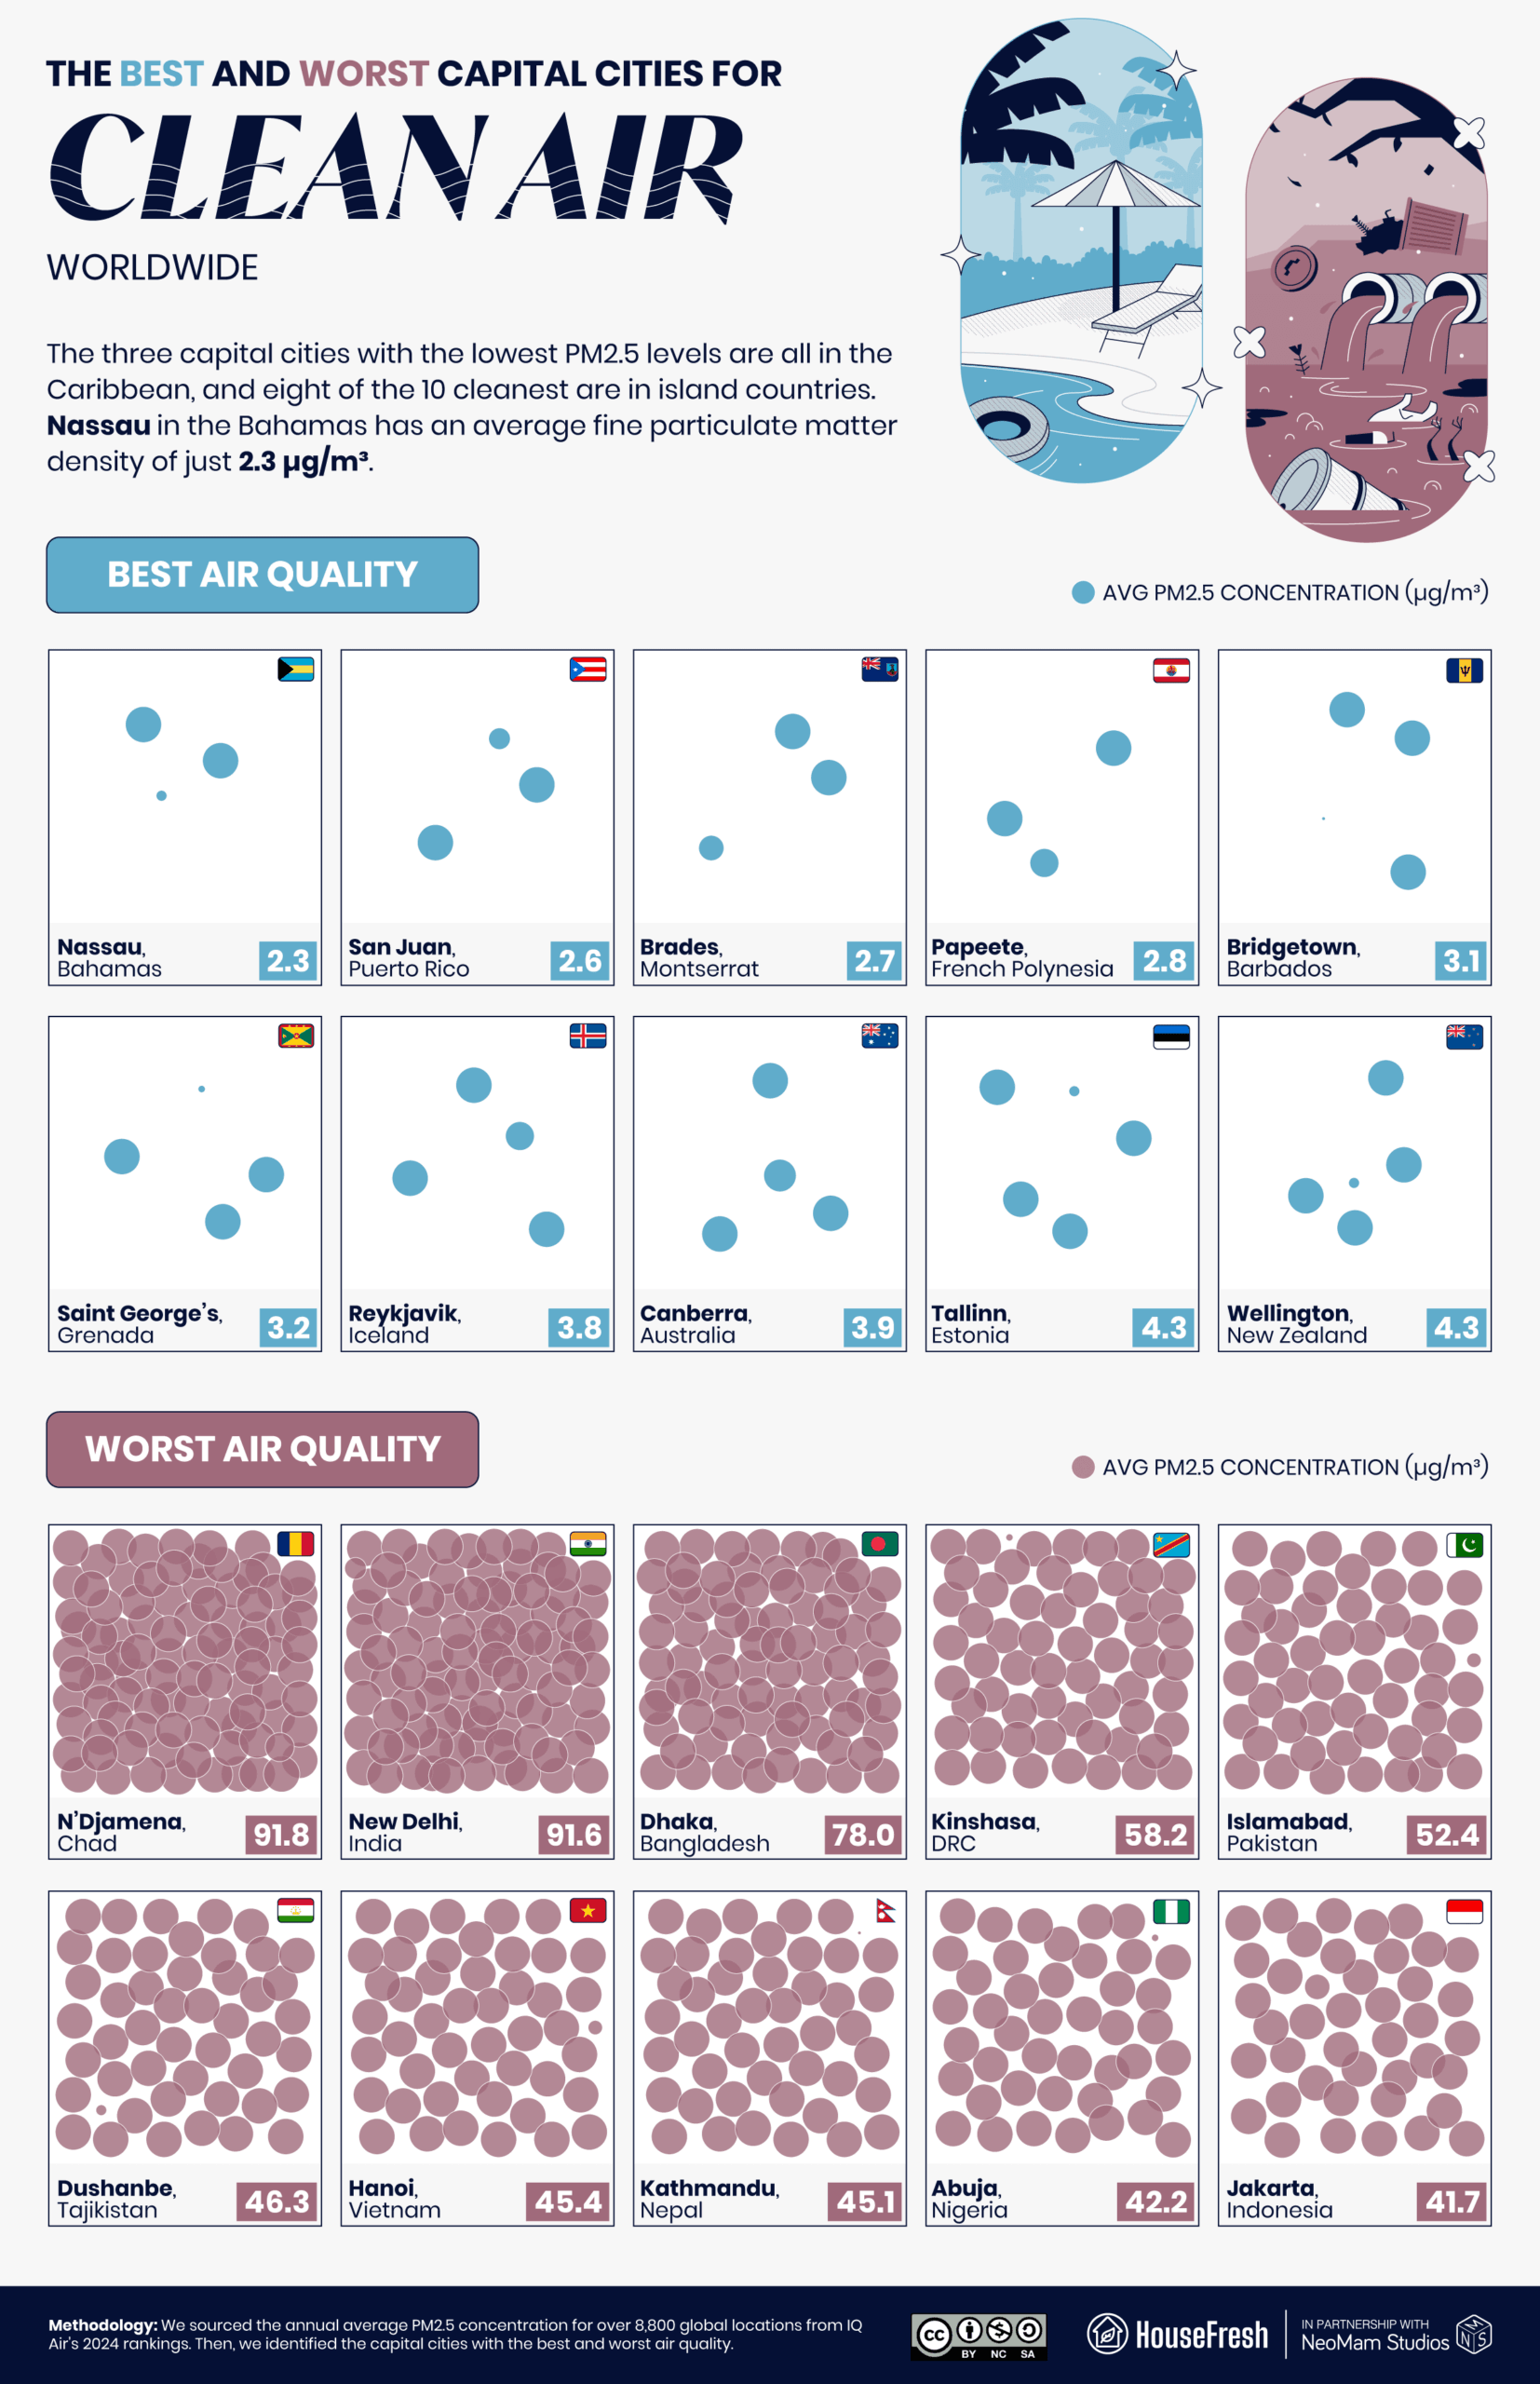
The geographic spread of the cleanest capitals is a little more diverse, with capitals from South and North America, Oceania and Europe. Nassau, capital of Bahamas, has the cleanest air of all, at an average of 2.3 µg/m³. IQAir attributes Nassau’s clean air to strong winds and the low level of industrial activity.
Canadian cities among worst – and best – for air in North America
Cities in Hawaii and Oregon boast PM2.5 levels below 2.5 µg/m³.
North America’s worst large towns and cities for clean air are almost all in Mexico. But the number one, Whitecourt in Canada (48.4 µg/m³), has nearly double the fine particulate matter in the air of any regional urban center. Wildfires across the Alberta province make bad air days a regular occurrence. Multiple studies have found that particulate matter from wildfires may lead to more hospitalizations than other forms of PM2.5.
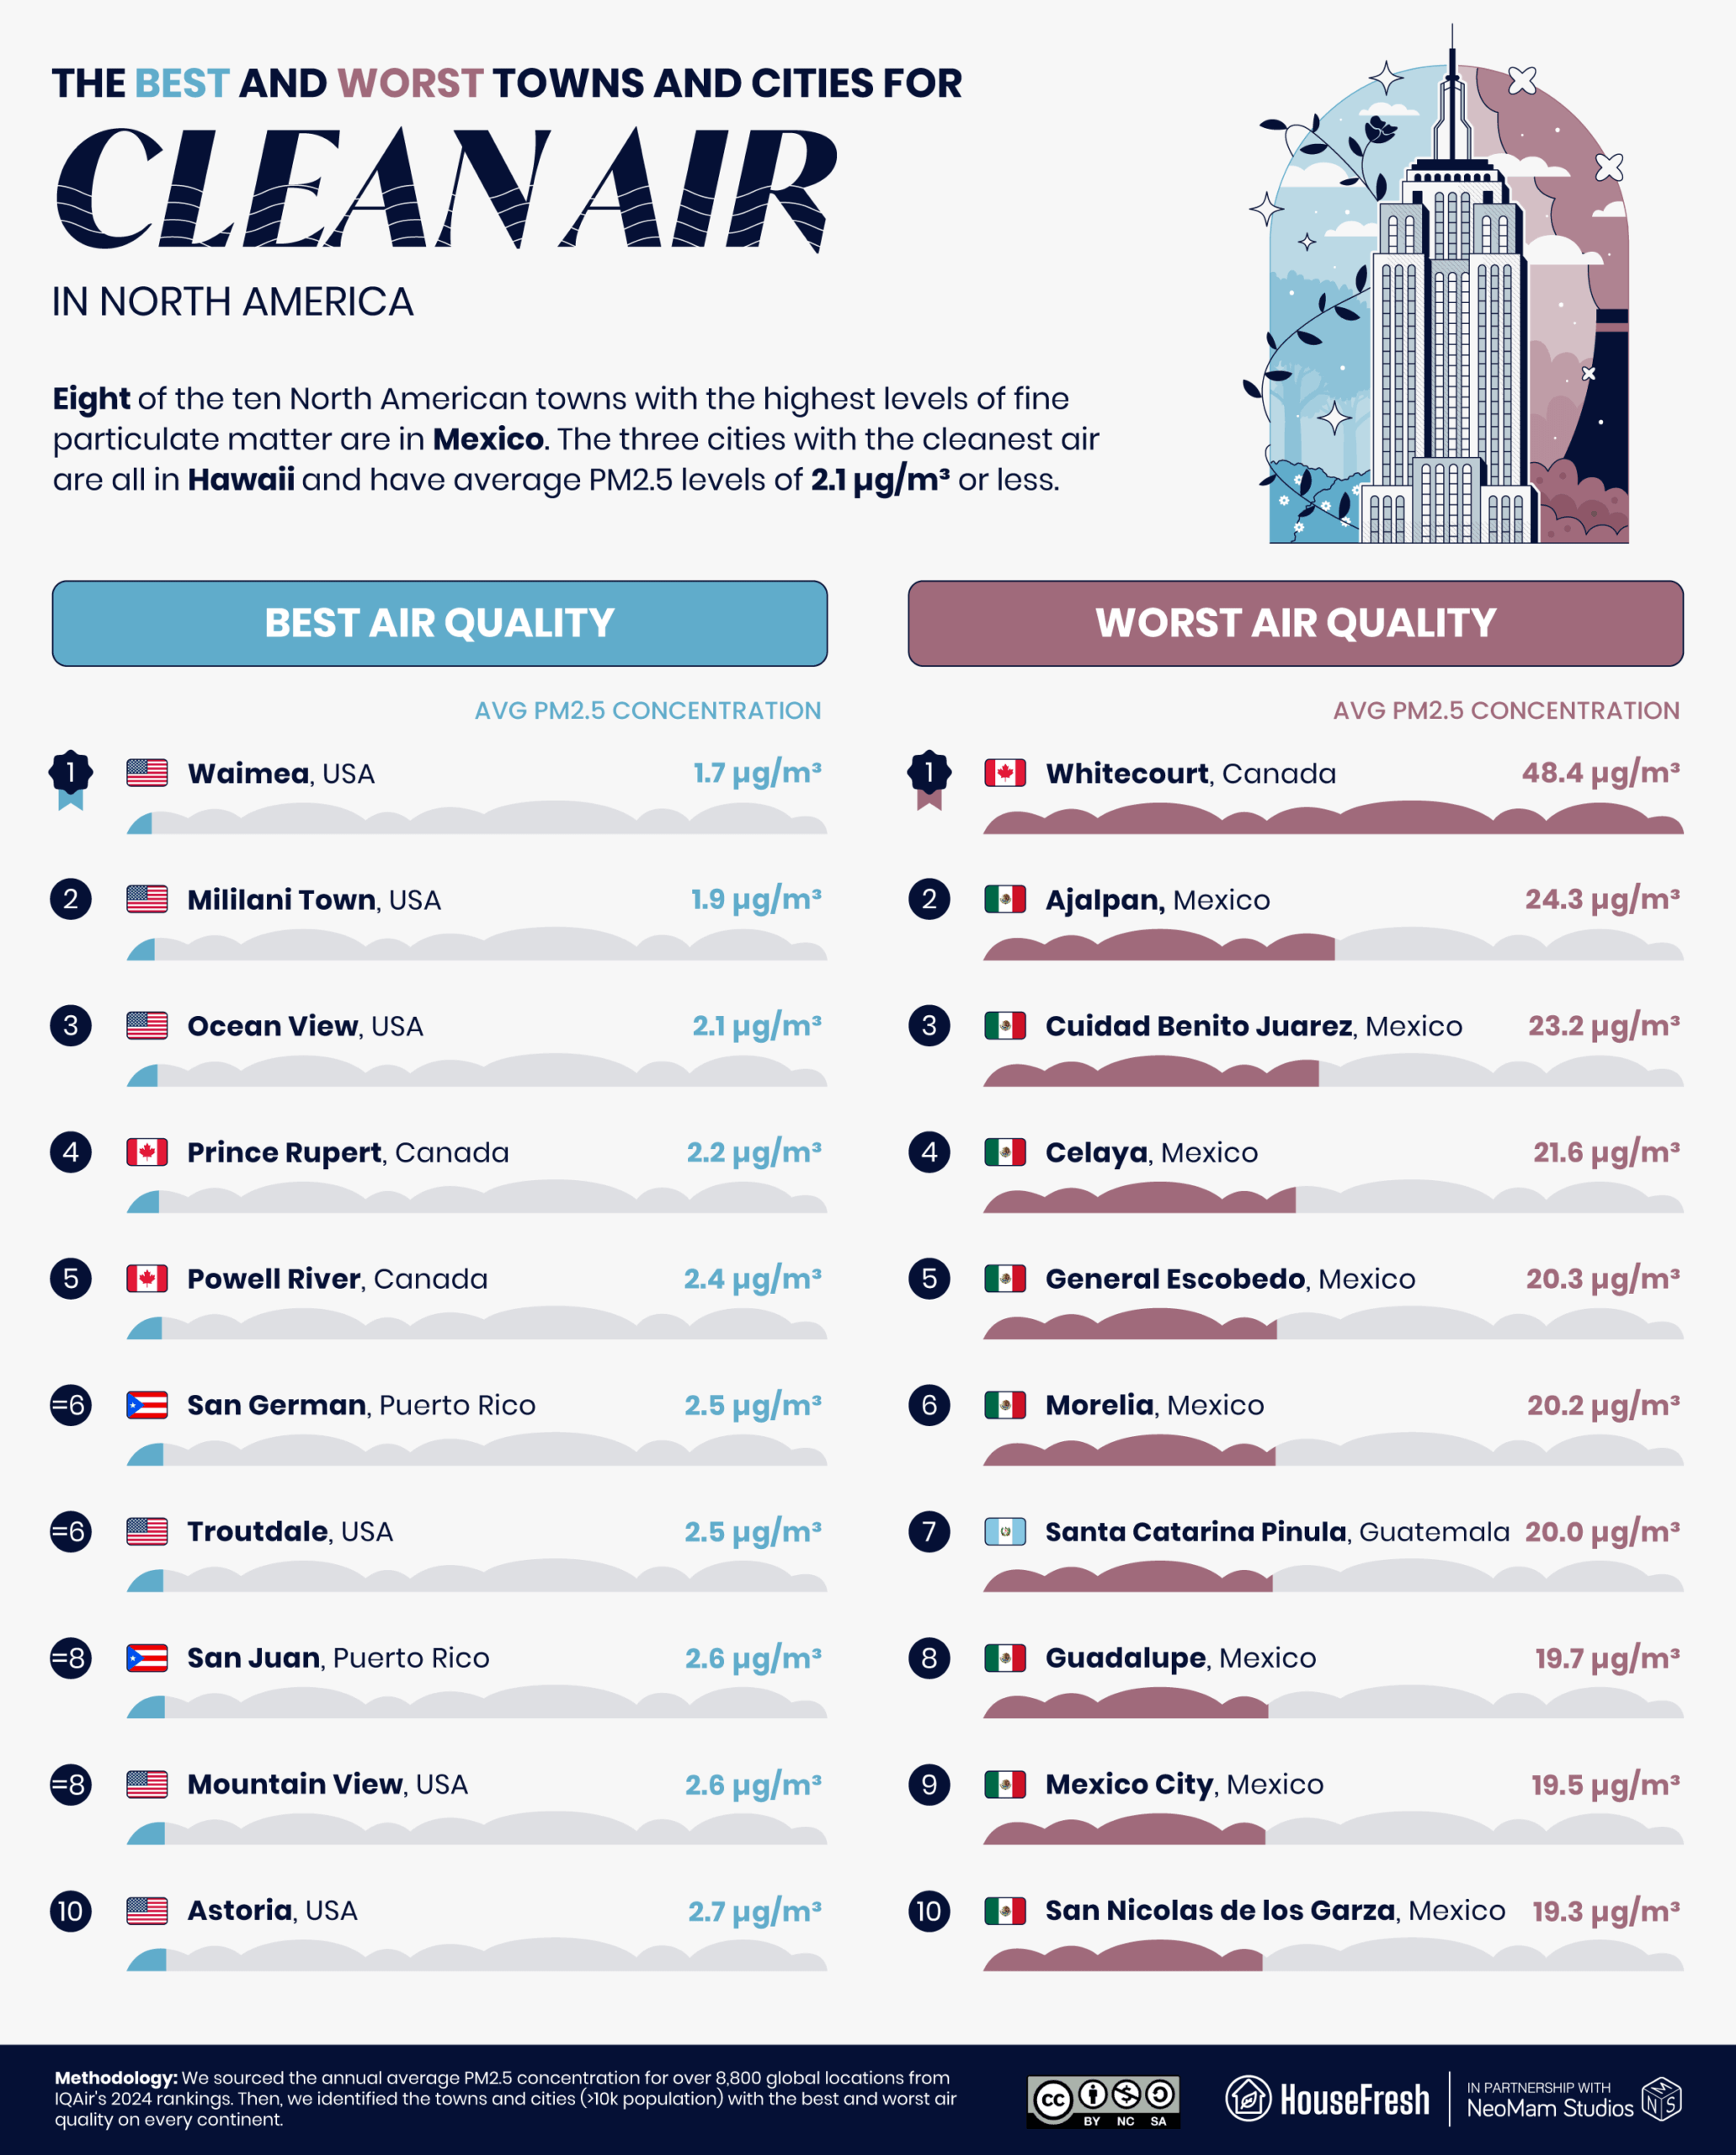
Two Canadian cities make the continent’s clean list, though: Prince Rupert (2.2 µg/m³) and Powell River (2.4 µg/m³). The cleanest in North America is Waimea (1.7 µg/m³, see above), while its Hawaiian neighbors, Mililani Town (1.9 µg/m³) and Ocean View (2.1 µg/m³), are also among the best cities for clean air.
Beyond Hawaii, the best city for clean air in the U.S. is Troutdale, Oregon, where the 2024 average was 2.5 µg/m³. The Oregon Energy Facility Siting Council recently vetoed attempts to build a 415-megawatt fracked gas power plant in the eastern part of the state.
“This is a huge win for Oregonians and the climate. Perennial (fracked-gas plant) would have locked the state into at least thirty years of additional climate-destroying pollution.
The message is clear: our future is in clean energy, not dirty fossil fuels.”
Lauren Goldberg
Executive director for Columbia Riverkeeper
Chile’s cities are among South America’s most polluted
But gas subsidies have made a difference in one Patagonia town.
Chilean urban areas dominate among the South American towns and cities with the worst air. Coyhaique is the worst, with PM2.5 levels at 40.5 µg/m³. “Coyhaique is confined to an area that is incredibly unfavorable in terms of ventilation,” Nicolás Huneeus of the University of Chile’s geophysics department told the Guardian. “Add low temperatures and cheap firewood to the mix, and the problem isn’t one that we can solve without a sustained, coordinated effort.”
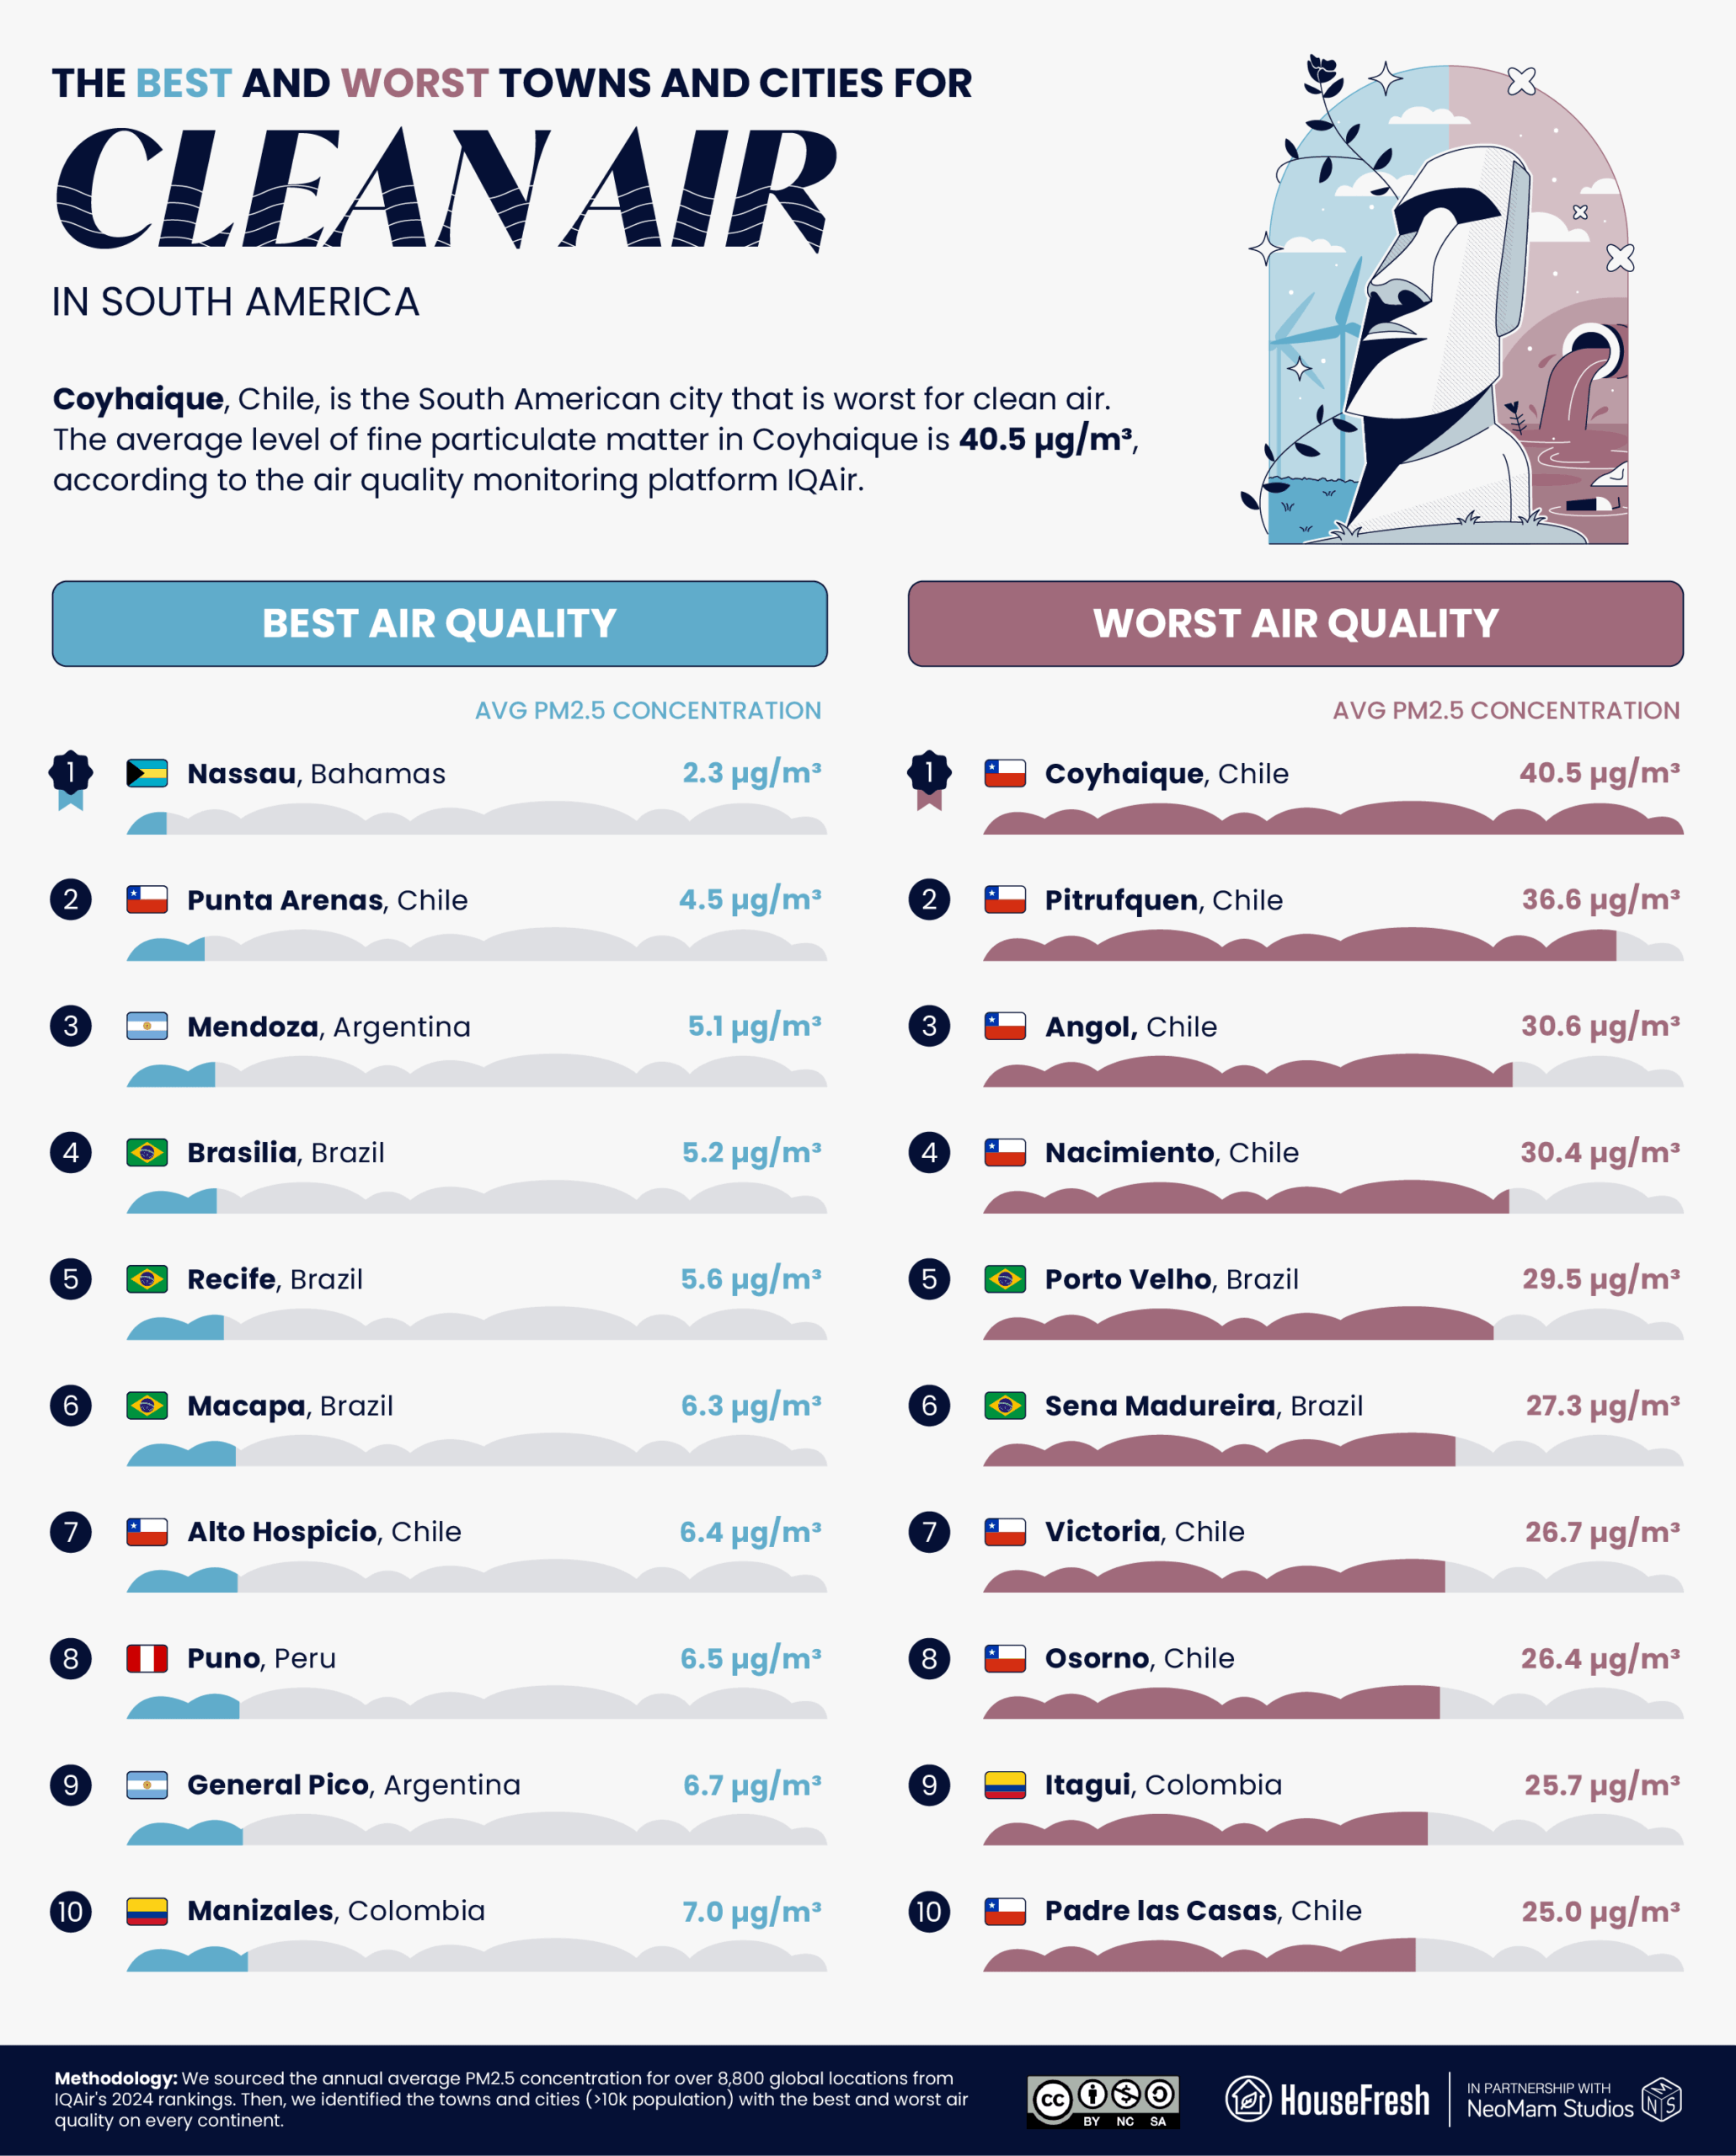
Around 60% of Chile’s population is exposed to annual average PM2.5 levels that exceed Chilean environmental regulations, and experts estimate that air pollution causes 4,000 premature deaths in Chile each year. However, there are two Chilean urban centers among the cleanest in the region: Punta Arenas (4.5 µg/m³) and Alto Hospicio 6.4 (µg/m³). Punta Arenas benefits from gas subsidies that have reduced local dependence on burning fossil fuels for heating and cooking.
Faro in Portugal has cleanest city air in Europe
The ten urban areas with the worst air are all on the Balkan Peninsula.
Europe’s most polluted big towns and cities are all in the Balkan region. Serbia’s poor air has been newsworthy since way back in the era of Yugoslavia, when one New York Times writer complained that the “choking, sulphurous atmosphere of Belgrade and several other major Yugoslav cities reddens eyes, shreds nylon stockings and ruins pianissimo passages in the concert hall because of the nearly continuous coughing it causes in audiences.” Coal-fired power plants, fossil fuel-based home heating and outdated vehicles contribute to the region’s poor air. It is worst in Novi Pazar, Serbia (38.8 µg/m³).
In Sarajevo, Bosnia and Herzegovina, one in 12 deaths is from lung cancer, according to Anes Podic, head of the environmental organization Eko-Akcija. A 2019 UN report found that one in five premature deaths in the Balkans is due to air pollution.
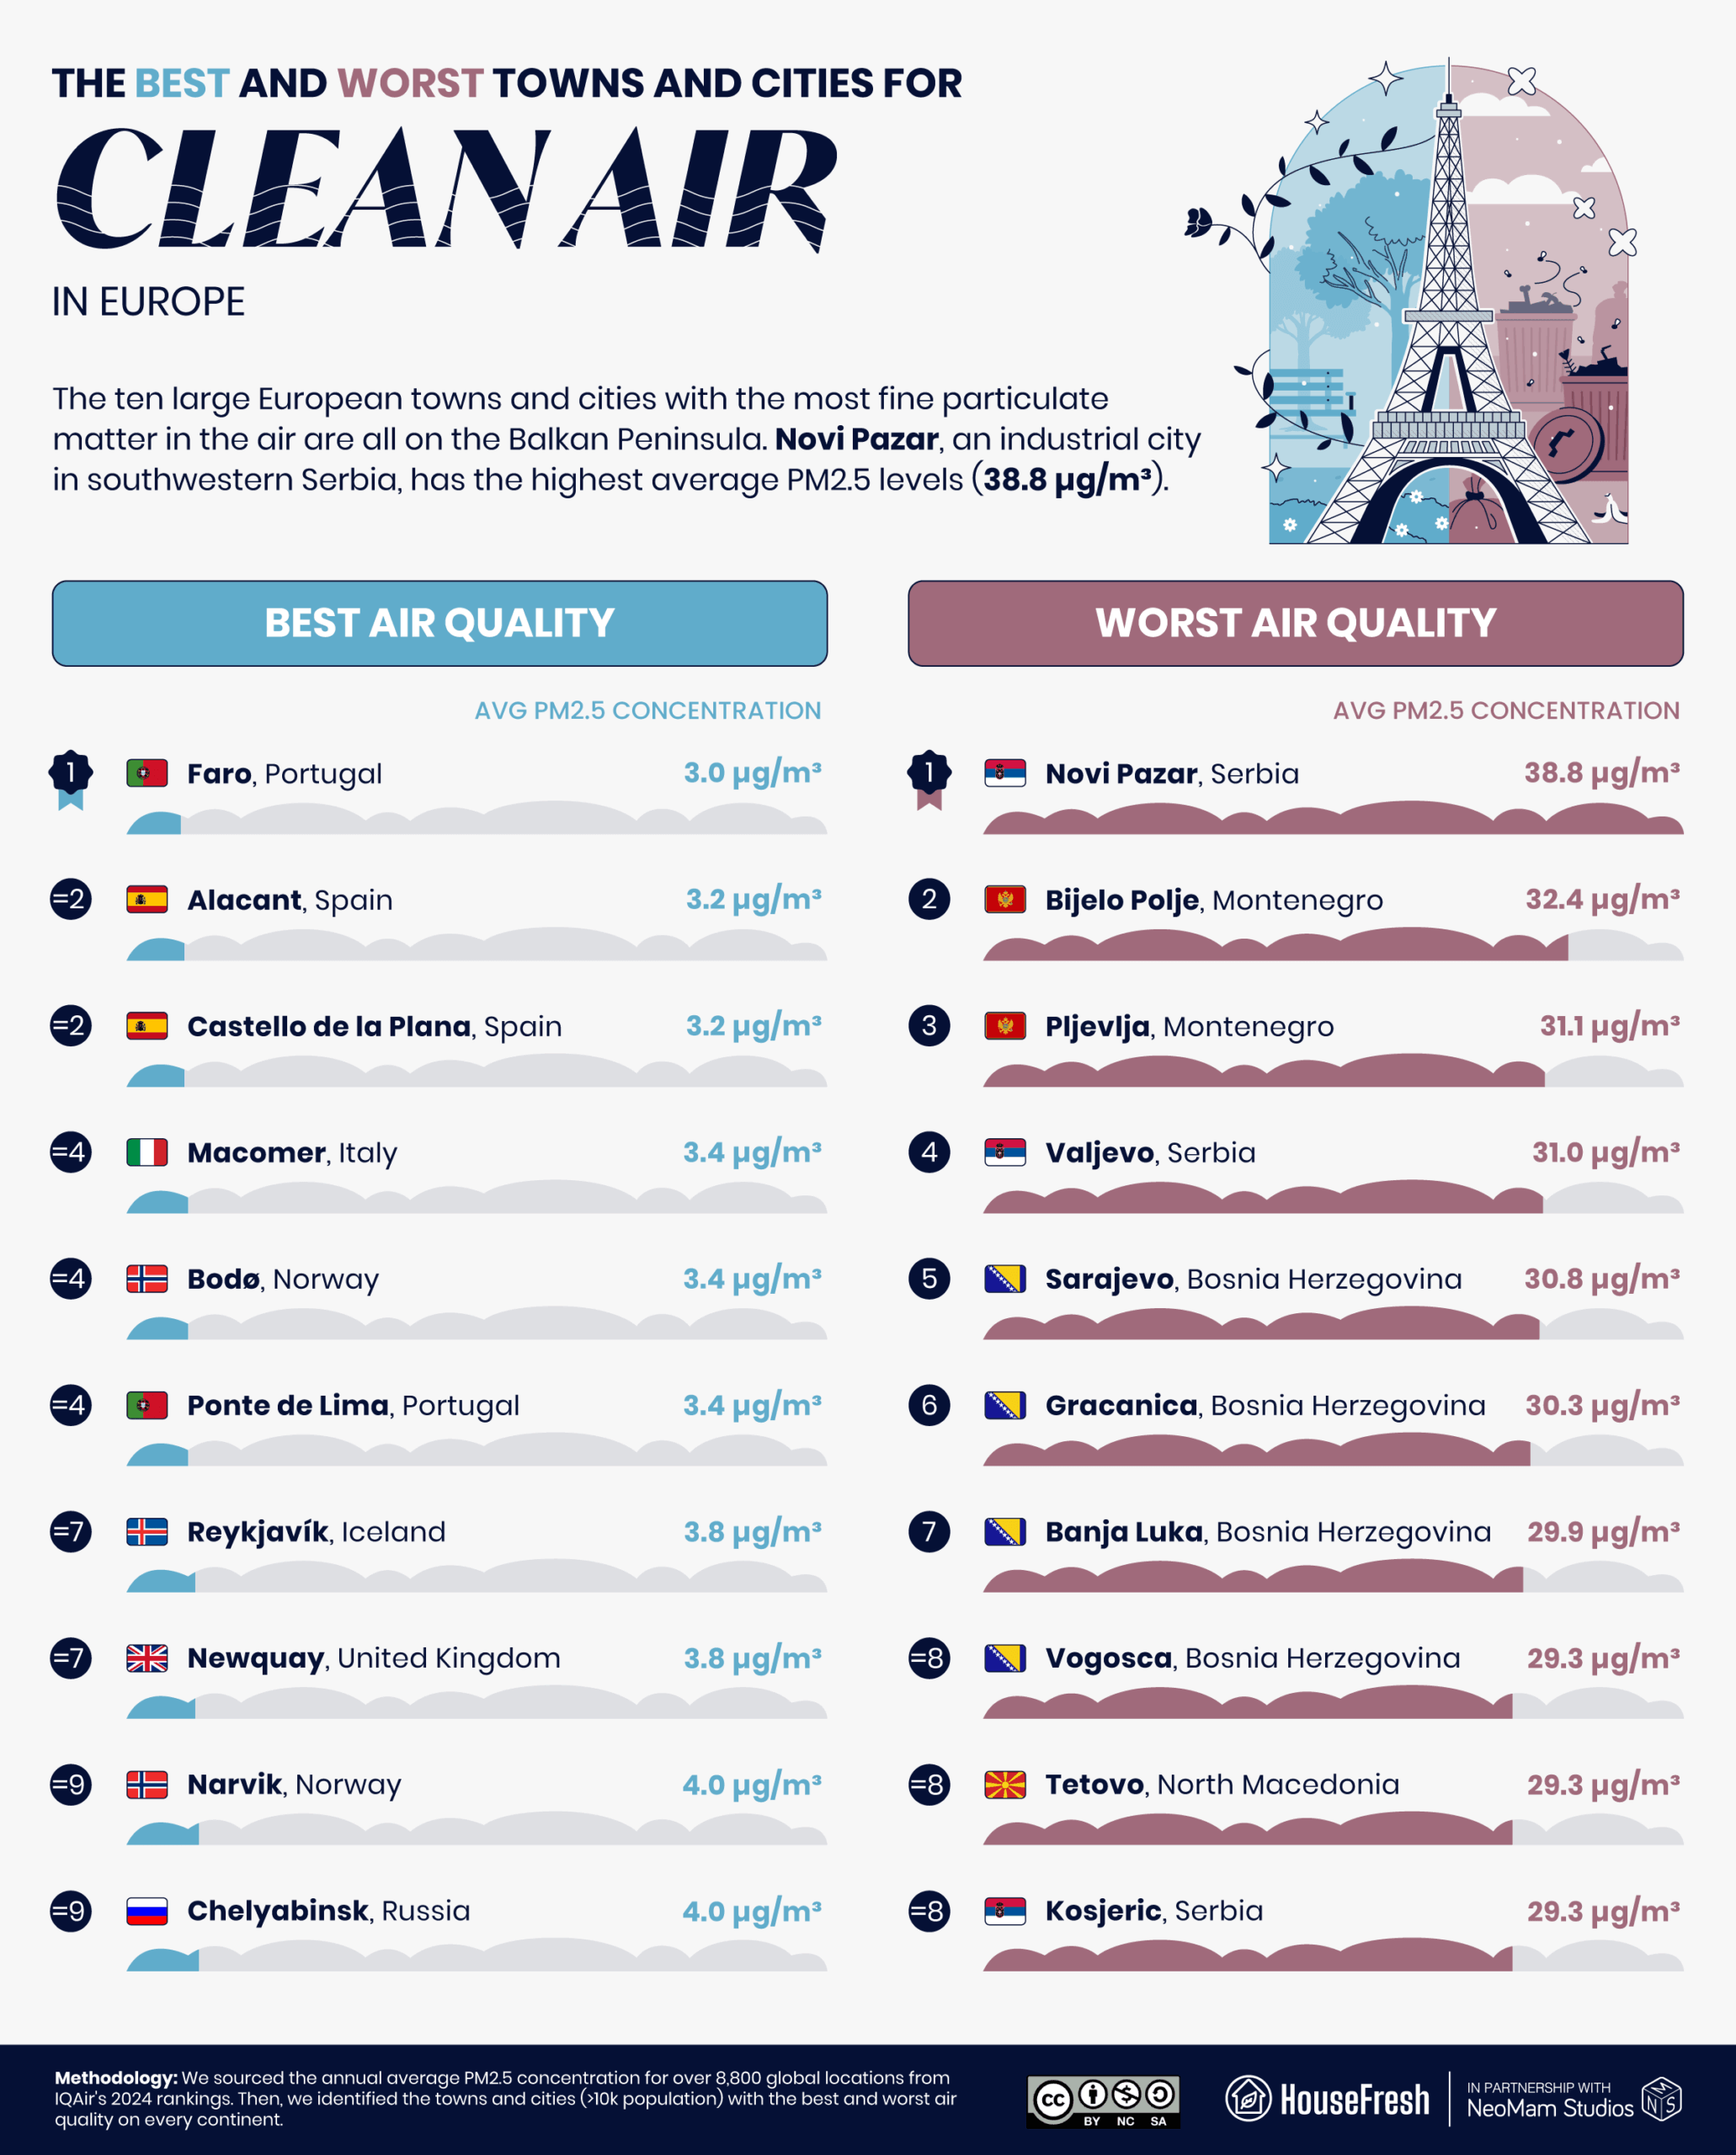
Europe’s best cities for clean air are in the west and north of the continent. In second and third place are two cities in Spain: Alacant (3.2 µg/m³) and Castello de la Plana (3.2 µg/m³). However, some cities across Spain have refused to implement low-emission driving zones, despite clear evidence that well-designed schemes work. For example, London’s ultra-low emission zone (ULEZ) reduced nitrogen dioxide from traffic by 46% across its first five years.
In Asia, Delhi air forces schools to close
The best cities for clean air in the region are in Kazakhstan and Japan.
Six of the ten worst Asian cities for bad air are in India. Delhi (108.3 µg/m³) authorities ordered schools to close, and hospitals were overrun in November 2024 as smog filled the city, generated by controlled crop fires, factory and traffic fumes, cooling air and stagnant winds.
“Smog is currently a national disaster,” said senior provincial minister Marriyum Aurangzeb. “It will not all be over in a month or a year. We will evaluate the situation after three days and then announce a further strategy.”
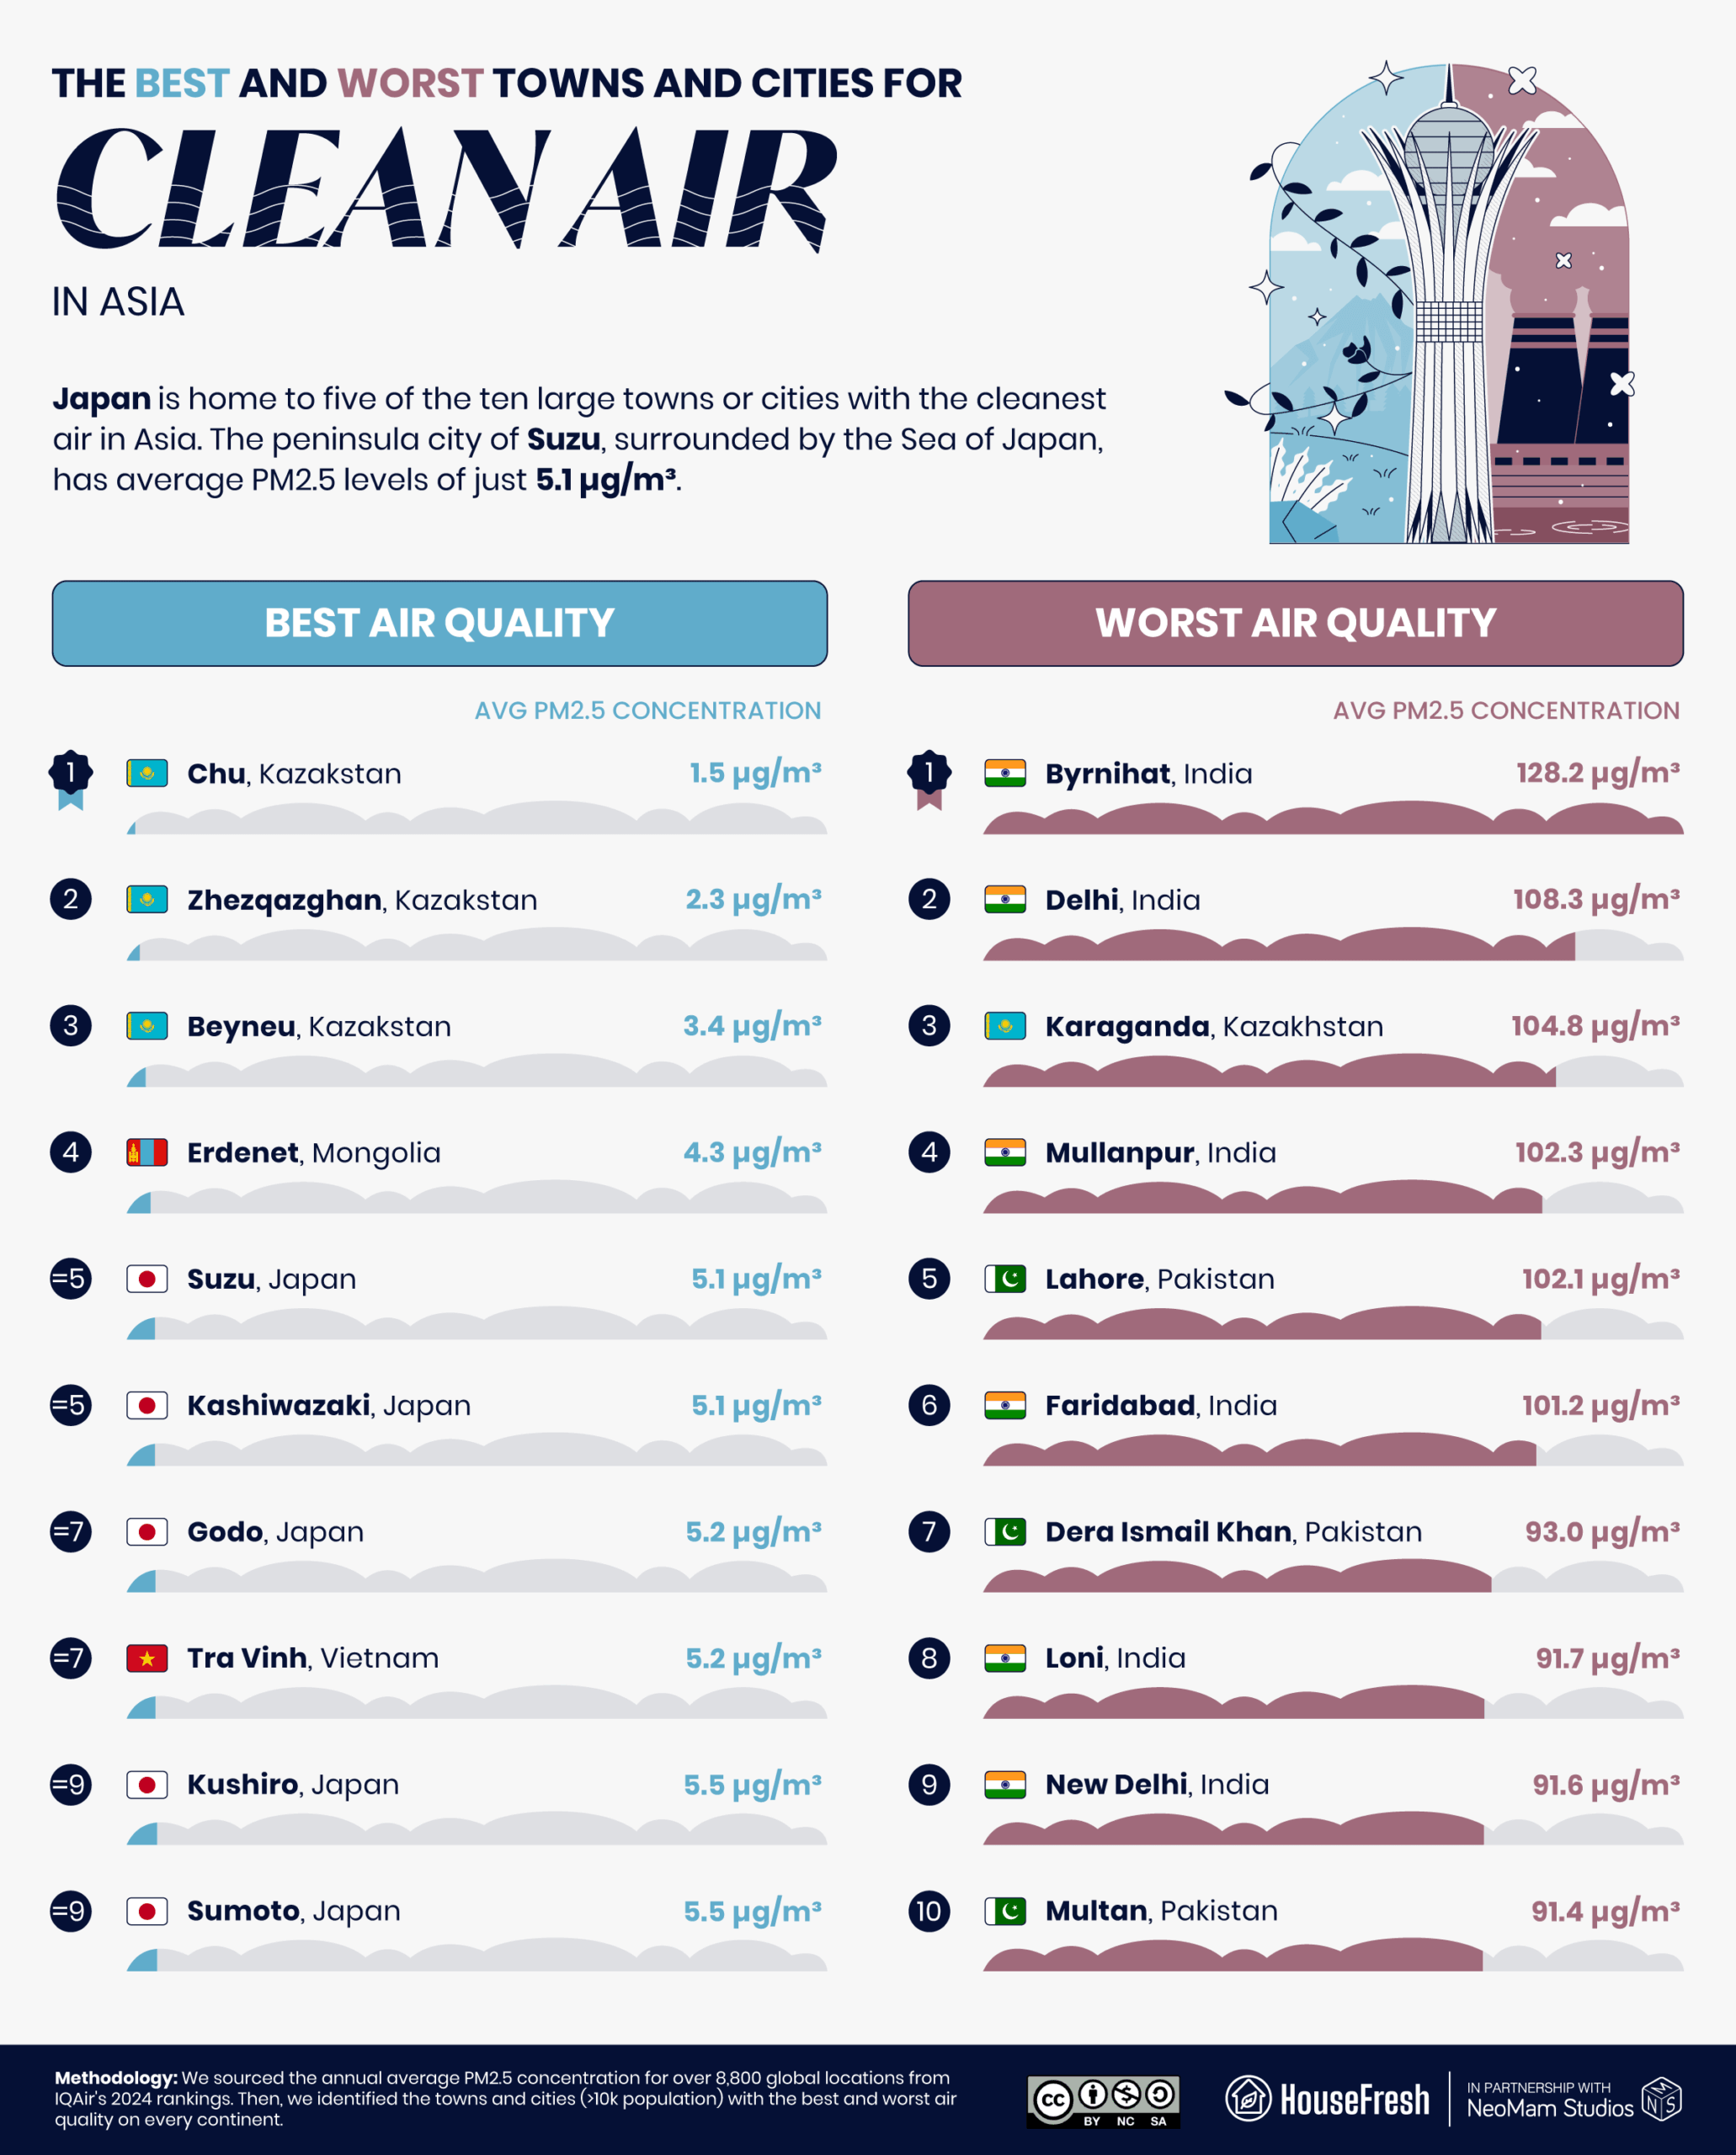
Kazakh and Japanese towns and cities dominate among those with the cleanest air in Asia. Japan’s best is Suzu (5.1 µg/m³) at the tip of the Noto Peninsula. Air pollution in Japan has improved due to the tightening of emissions regulations for motor vehicles. However, in some regions, up to 61% of PM2.5 concentrations in the air have historically originated overseas in China.
Australia’s least polluted cities have cleaner air than New Zealand’s
But industrial heritage means problems still persist.
In the battle of Oceania, Australia proves to have the cities with the cleanest air, while New Zealand’s urban areas dominate among those with bad air. However, it’s all relative: even Oceania’s worst town for clean air, Richmond in New Zealand (10.5 µg/m³), has an average PM2.5 level that almost places it among the ten cleanest of other continents.
The chief problem with Richmond air is that wood heaters remain popular among the local population. Authorities have encouraged citizens to collect firewood earlier in the year to ensure it’s of better burning quality while they consider adding regulations.
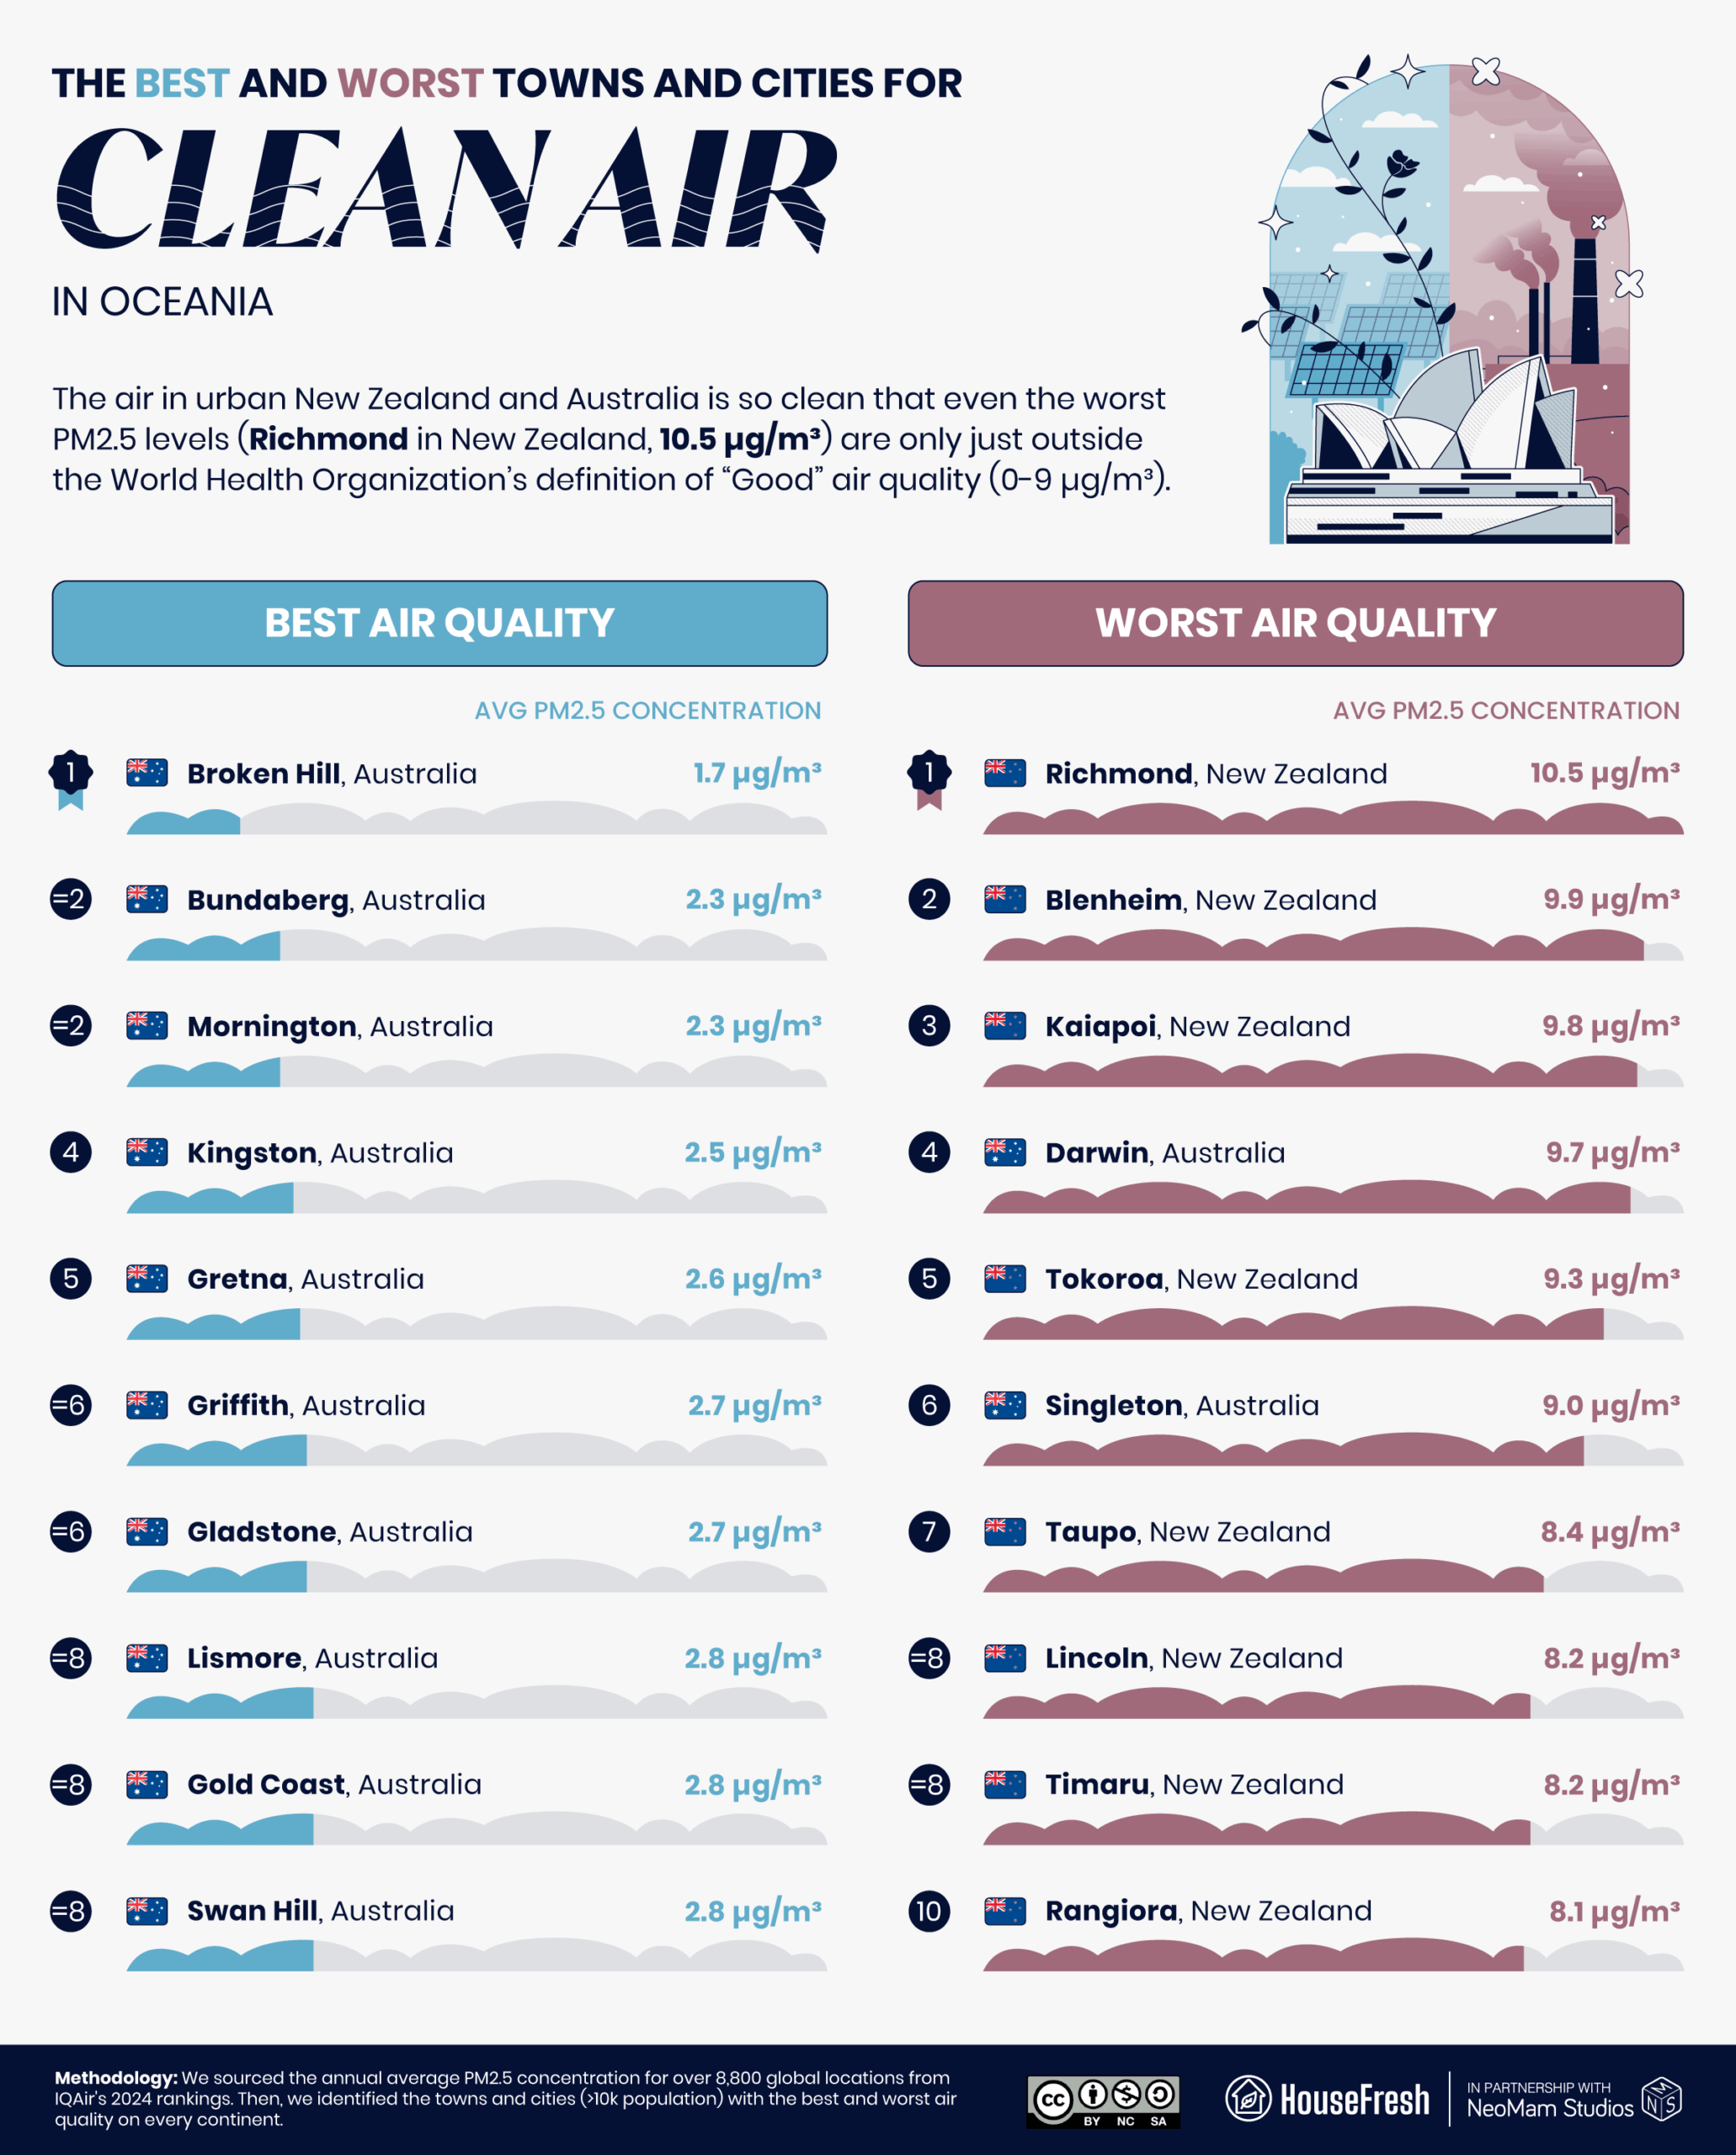
All ten of the continent’s cleanest large towns and cities are in Australia. Broken Hill (1.7 5 µg/m³) is a remote outback city in New South Wales and has the cleanest air of any continental urban area. However, the city has been known to suffer from dust storms and has been blighted by toxic residues from local mining operations — children exposed to this air were shown to perform lower on school tests.
South Africa leads quest for cleaner air in African cities
But Africa’s most polluted cities are among worst in the world for clean air.
IQAir’s 2024 World Air Quality Report notes that “considerable gaps still exist in government-operated regulatory systems in many parts of the world.” Africa is singled out in this respect: while there are eight African countries among the 15 with the worst ‘worst cities’ in the world, it is notable that the continent maintains only one monitoring station for every 3.7 million people, so the true extent of Africa’s urban air crisis cannot be told.
Still, there is enough data to show that Africa’s ten worst cities for clean air almost all have higher PM2.5 counts than the ten worst on other continents — with the exception of Asia.
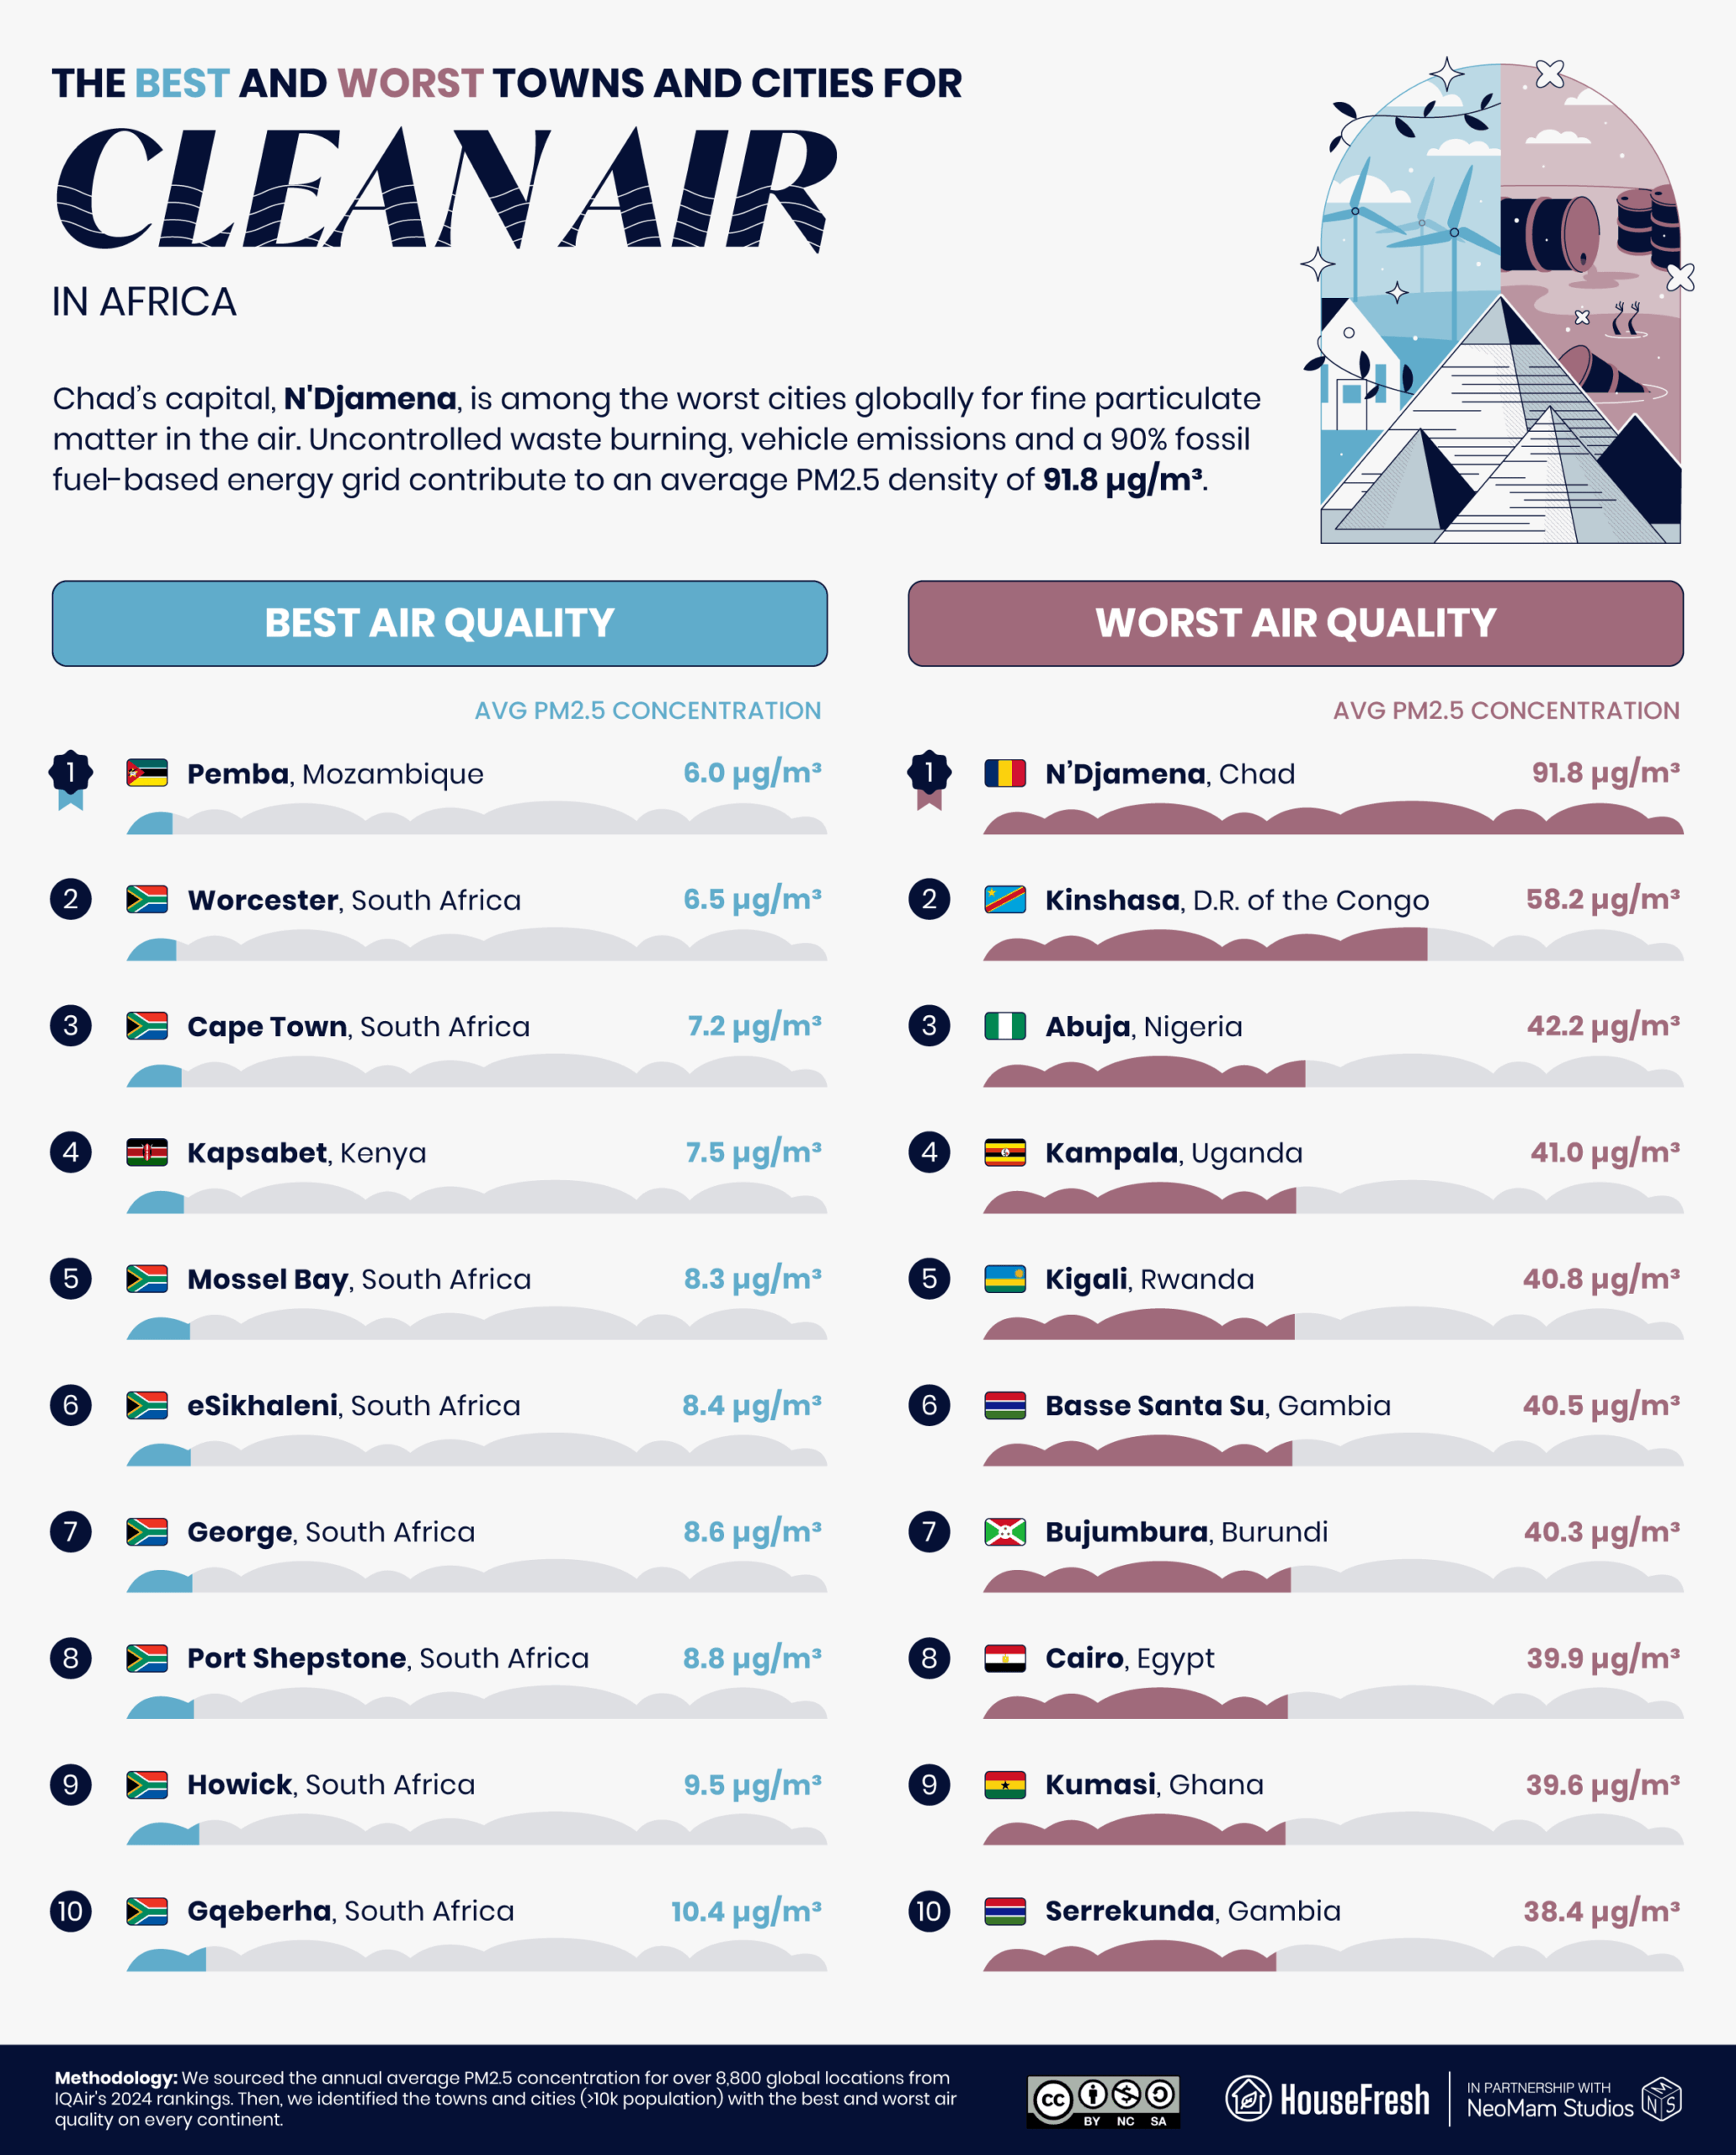
Eight of the ten large towns and cities with the cleanest air in Africa are in South Africa. However, Pemba, Mozambique, is Africa’s best city for clean air, with average PM2.5 levels of 6 µg/m³ in 2024. Corporate sustainability initiatives have helped nearly 5,000 local households switch to improved cooking stoves that consume less coal and create less smoke.
Keeping a clean air environment at home
City dwellers can’t afford to wait for governmental action on air pollution.
The vast majority of the world’s urban population lives with bad air. IQAir’s 2024 report on world air quality found only 12 countries with PM2.5 levels within the World Health Organization’s guideline of 5.0 μg/m³. As national and regional efforts to reduce industrial and vehicular emissions falter, entire categories of pollution remain unaddressed: for example, vehicles produce six million tonnes of particulate matter from tire wear per year globally, which is more than that emitted by tailpipes. This issue won’t be remedied by the introduction of electric cars.
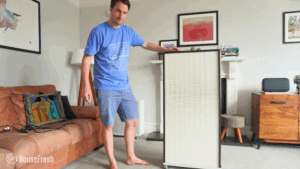
On bad air days, keep to back streets and away from the road’s edge when walking outside, and close your car windows when driving. At home, the EPA recommends the use of air filters to remove pollutants from the air. We have published a thorough guide to air purifiers, where you will learn more about what to look for and what to avoid.
METHODOLOGY & SOURCES
We sourced the annual average PM2.5 concentration for over 8,800 global locations from IQAir’s 2024 rankings. We then identified the towns and cities (with a population above 10,000) with the best and worst air quality in every country and continent. In addition, we ranked the top and bottom 10 capital cities based on air quality.