The best and worst U.S. states for allergies

Header The Best and Worst U.S. States for Allergies

Allergies are your body’s immune system reacting to a foreign substance, such as pet dander, pollen or shellfish, with clinical symptoms, such as coughing or swelling.

Over a quarter of U.S. children (27.2%) and nearly one-third of adults (31.8%) report having some kind of allergy, according to the National Center for Health Statistics. This equates to over 100 million people.

Seasonal allergies affect around five times more people than food allergies, yet they can be much harder to avoid. Both the seasons and the local climate affect the severity of indoor and outdoor allergies, such as animal dander and pollen. This leads to reactions that range from the irritating to the life-threatening: itchiness, sneezing or even asthma attacks.

There is no cure for allergies, but you can manage, prevent, or treat them. Since indoor and outdoor allergies respond to environmental conditions, one form of prevention is simply to be in the right place at the right time.

With that in mind, we have analyzed allergen data and statistics on local environmental conditions to identify the U.S. cities and states where indoor and outdoor allergies are most and least severe.

We analyzed data on indoor and outdoor allergens across the United States to determine where they are most prevalent, calculating a relative severity rating of 0 (low) to 10 (severe) and finding the average score across allergen types in each location.

For outdoor allergens, we used data from the pollen.com website to calculate the average annual severity of tree, grass, and ragweed pollen for over 970 cities across the U.S. and calculated the average values by state by aggregating cities.

For the indoor rankings, we found data for the 100 most populated cities in the U.S. on six factors: rainfall, temperature, humidity, age of homes, dog ownership and cat ownership.

Key findings 

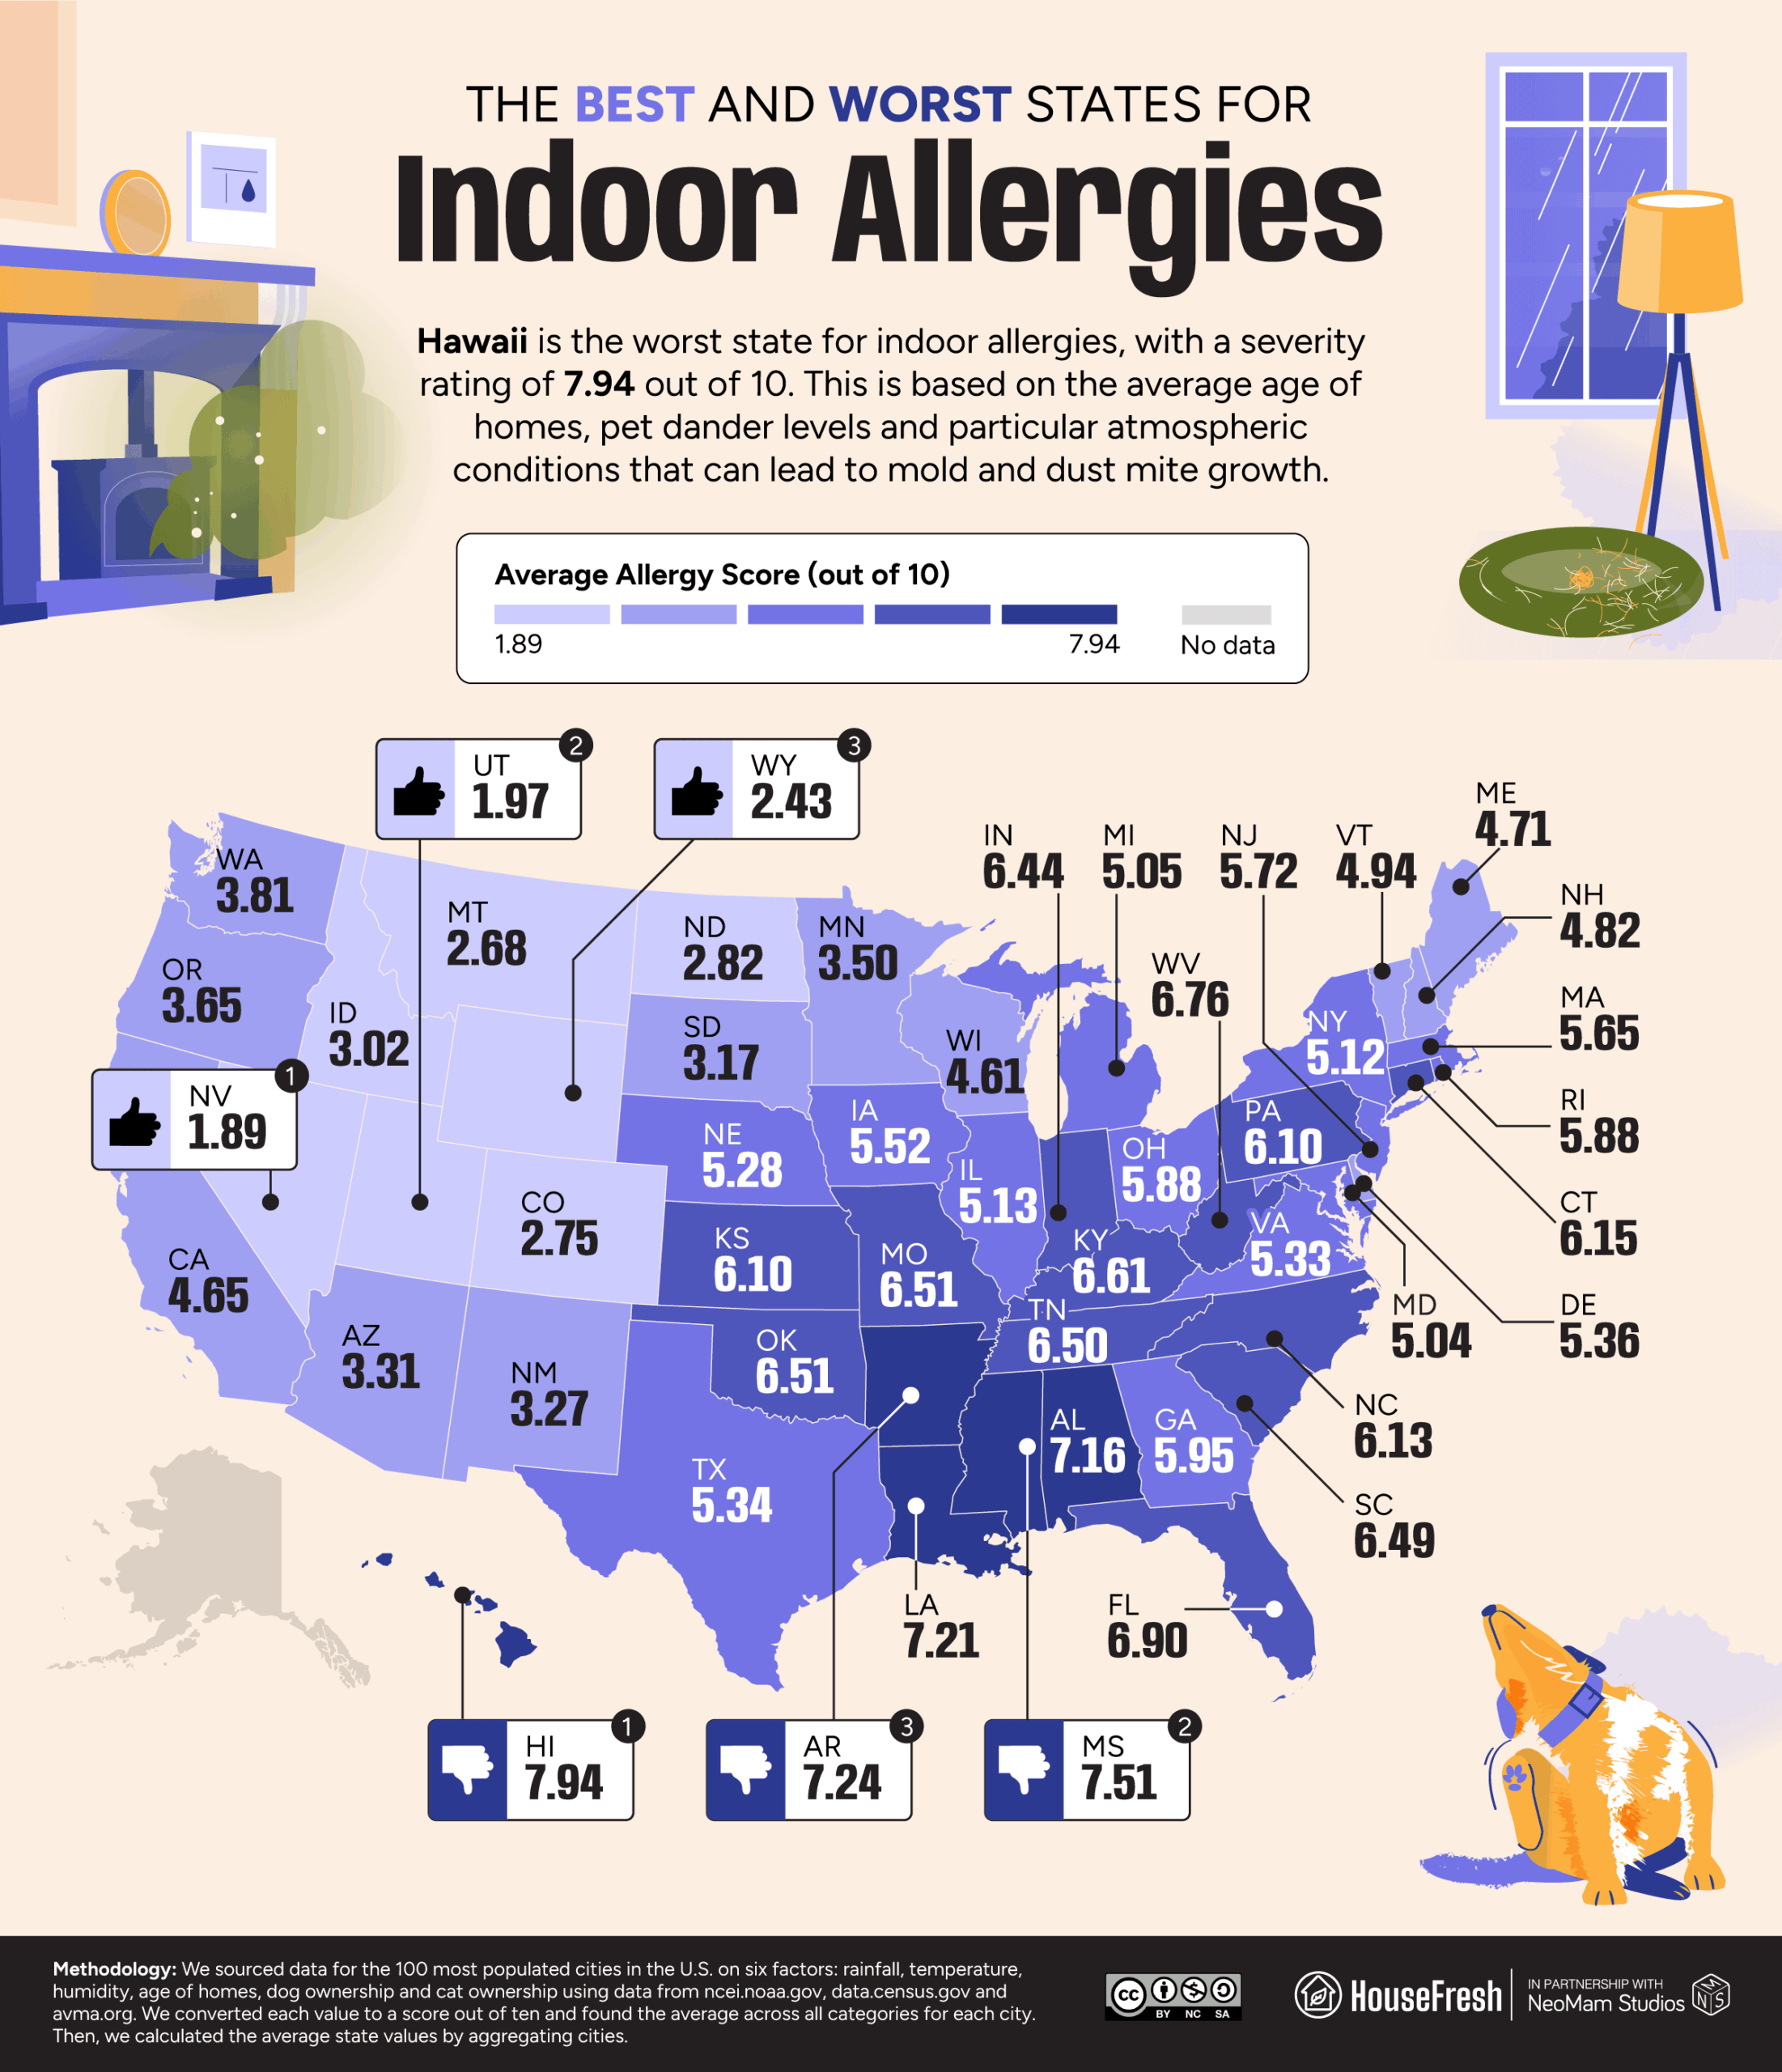
  • Hawaii is the worst state for indoor allergies, with an average severity rating of 7.94 out of 10 across five indoor allergy variables.

  • Laredo, Texas, is the worst city for outdoor allergies (9.11), whereas Jackson, Mississippi, is the worst city for indoor allergies (8.33).

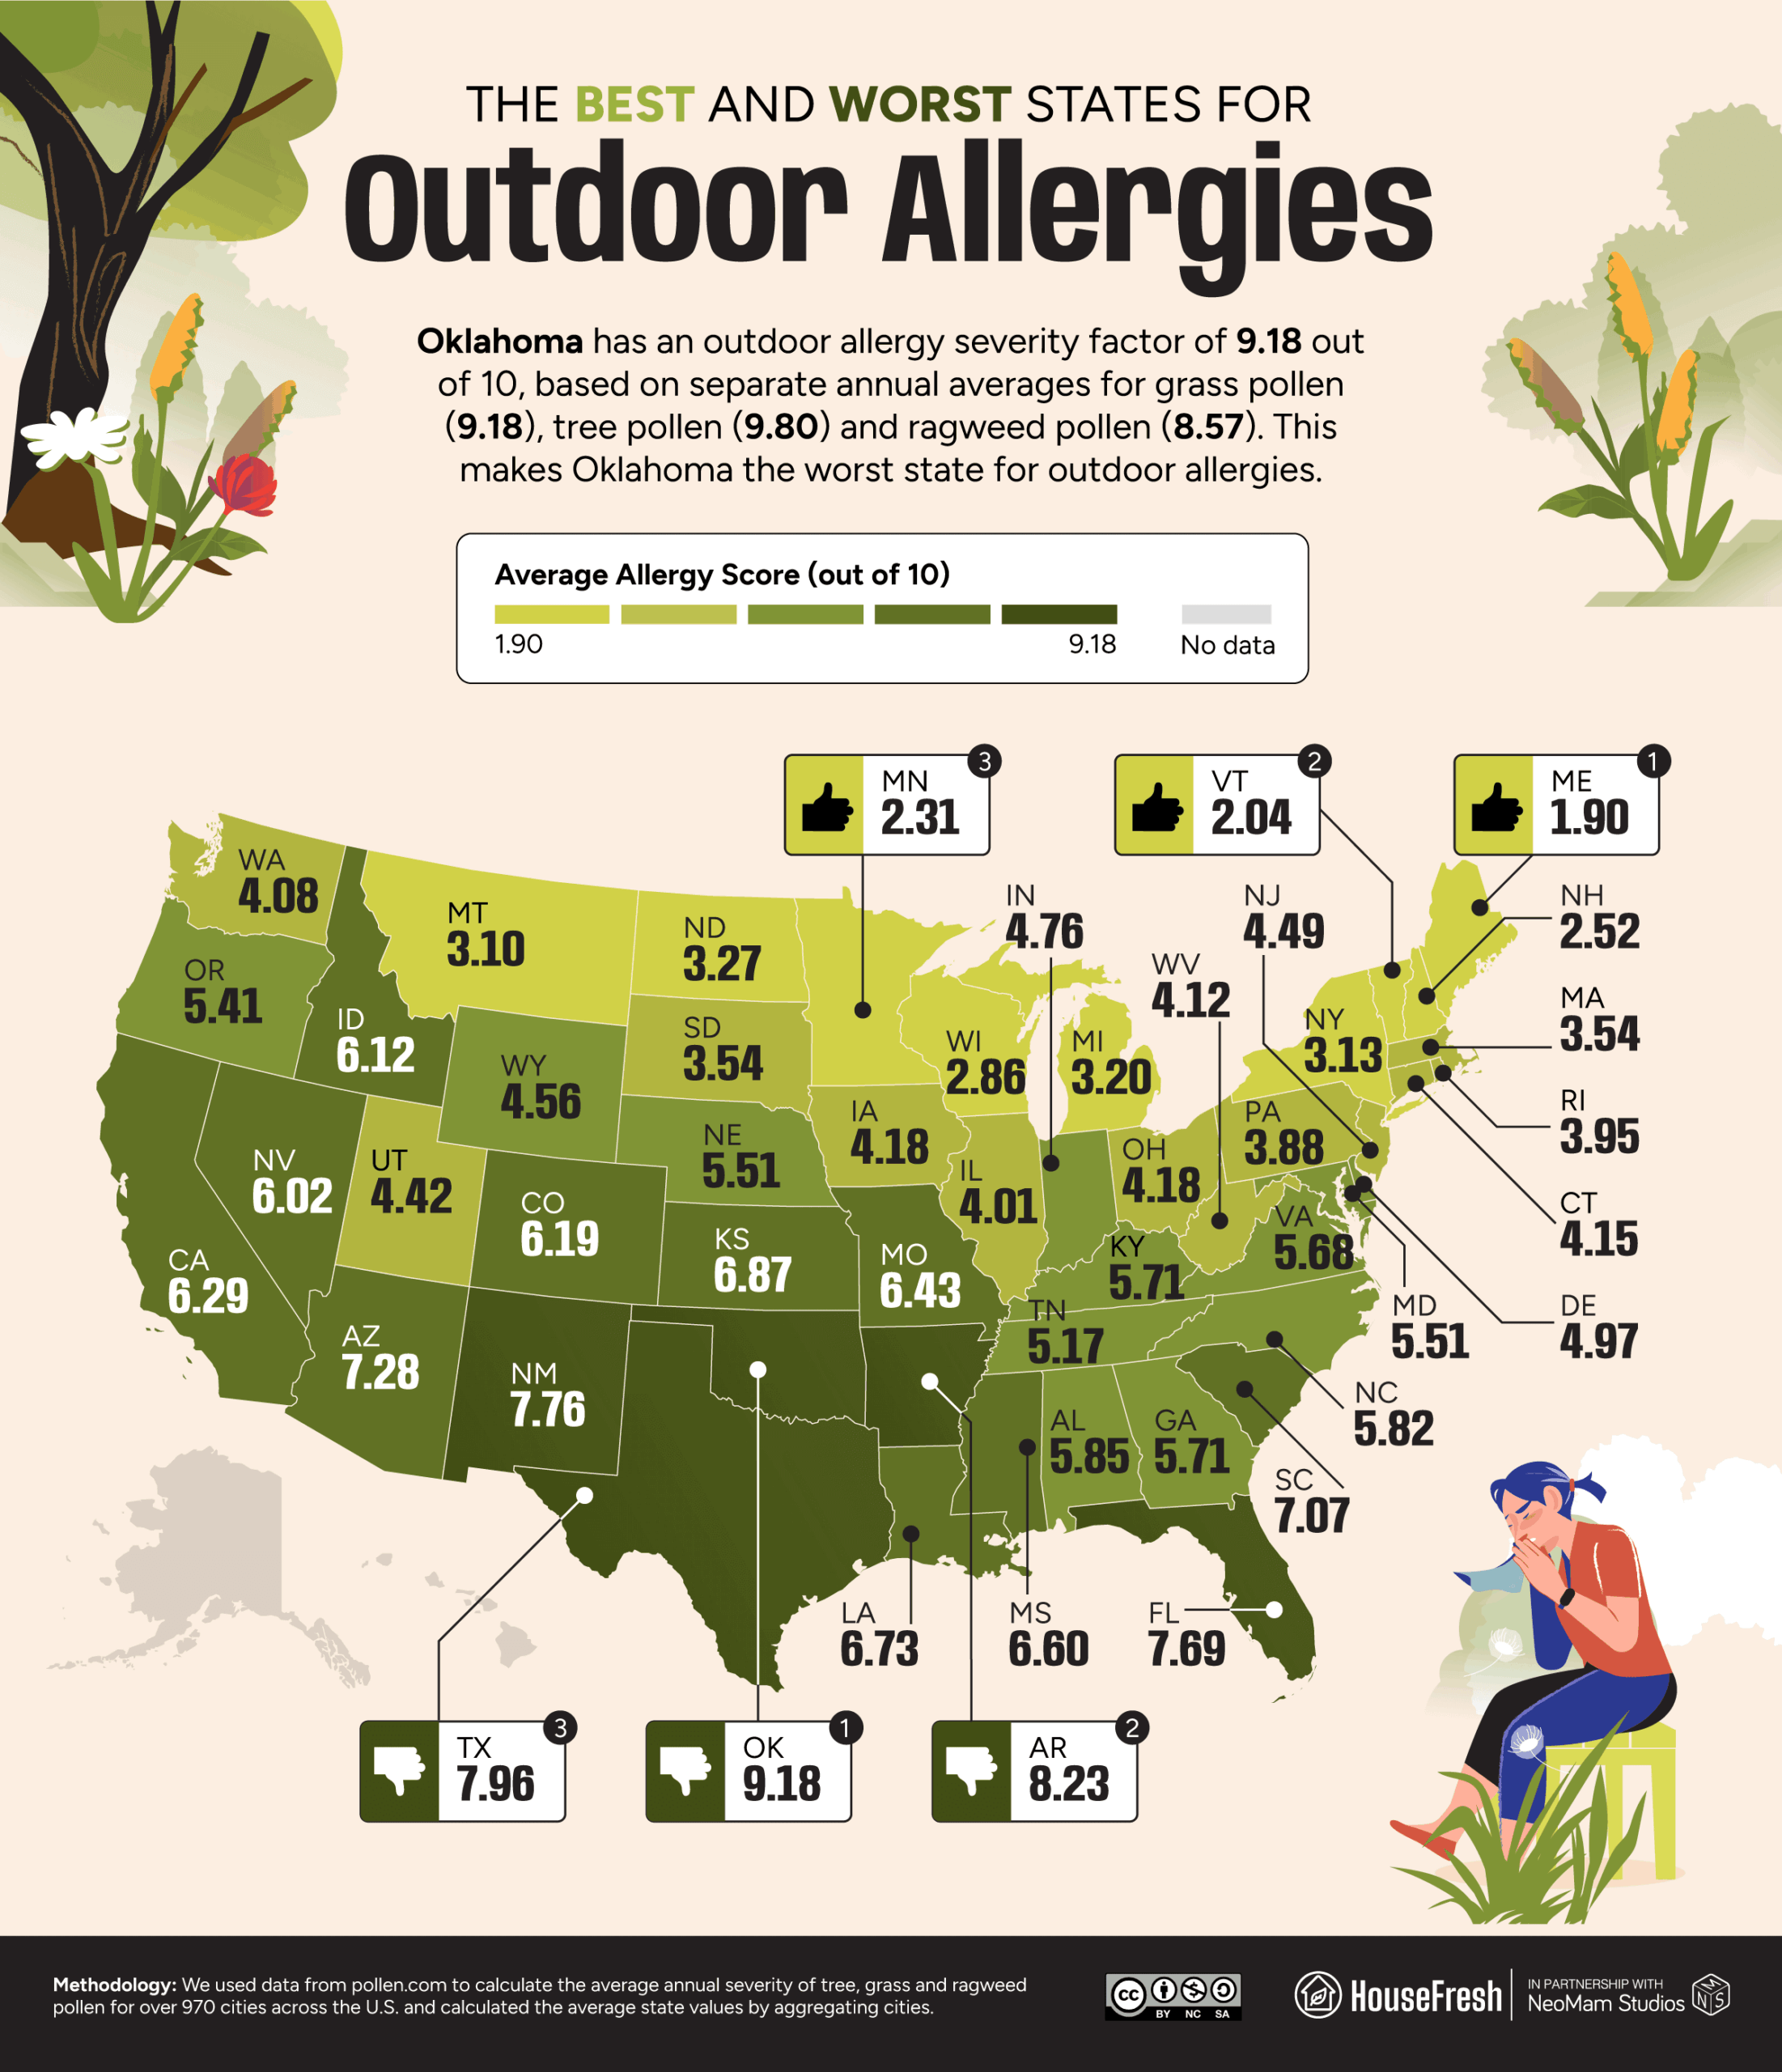
  • Oklahoma is the worst state for outdoor allergies, with a severity rating of 9.18 out of 10.

  • Reno, Nevada, is the best city for indoor allergies, with a severity rating of just 1.79 — significantly lower than any other major city.

  • Texas has severe outdoor allergy ratings (10/10) for both grass and tree pollen.

  • Climate change is leading to greater amounts of pollen in the atmosphere.

Southern states and cities suffer from the most severe outdoor allergies

Oklahoma is the worst overall, but Texas is the worst for grass and tree pollen.

First, we identified the states and cities with the highest and lowest outdoor allergy risks. We found the highest concentrations are in southern and particularly south-central states.

Oklahoma has the worst average severity (9.18) based on grass pollen levels of 9.18, tree pollen at 9.80 and ragweed pollen at 8.57. However, people are allergic to different types of pollen, and it’s worth noting that Texas has worse levels of grass and tree pollen (both with a severity rating of 10, i.e., the worst in the U.S.). Only its low ragweed pollen count (3.88) puts Texas’s overall severity rating lower than those of Oklahoma and Arkansas.

Map of the United States showing the best and worst states for outdoor allergies in 2025 and beyond, based on an allergy severity score made up of grass, tree and ragweed pollen levels in each state.
Map showing the best and worst U.S. states for outdoor allergies, highlighting regions with varying pollen levels and allergy severity.

Why the South? Rising levels of carbon dioxide lead plants to produce pollen while warming the climate. A warming climate leads to earlier, longer and more intense pollen seasons. So-called “seasonal” allergies now stretch to fill the whole calendar year in some locations — particularly in the Southern “pollen belt,” where it was warmer to start with and where strong winds circulate more pollen in the air and for longer.

“We know that climate change is leading to greater amounts of pollen in the atmosphere. It’s changing the seasonality of the pollen. It’s changing the types of pollen that we’re exposed to.”

Paul Beggs
Environmental health scientist, Macquarie University in Sydney

The worst cities for outdoor allergies follow this same pattern, with three Texas cities (Laredo, San Antonio and Lubbock) among the top five.

Data visualization showing the five best and five worst U.S. cities for outdoor allergies, based on a 2025 allergy severity ranking.
Ranking of U.S. cities by outdoor allergy levels, based on an allergy severity score made up of grass, tree and ragweed pollen levels in each area.

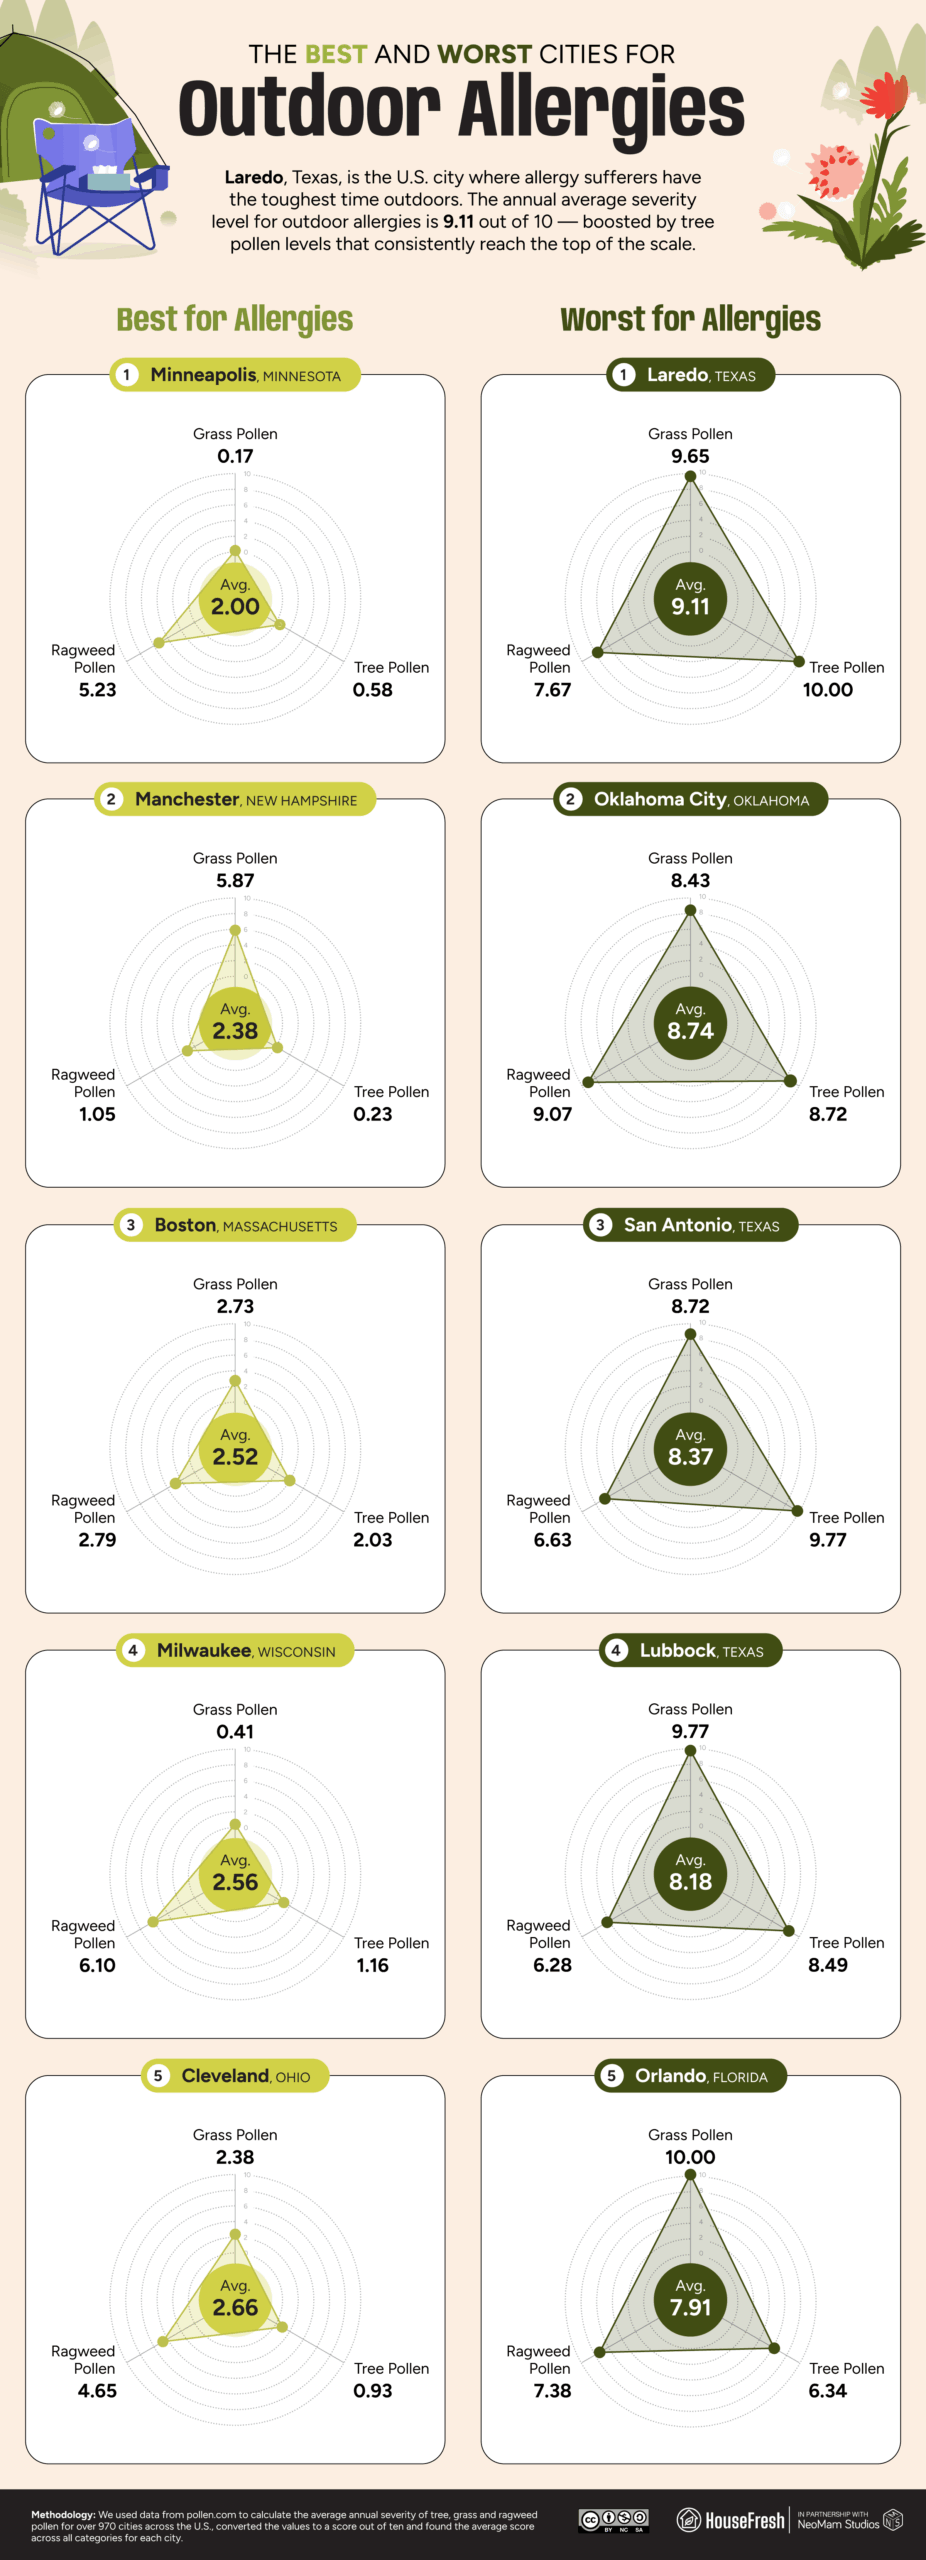
Ragweed tends to prosper on land that’s been developed by humans, which may be one reason that ragweed pollen levels are around twice the average Texas level in these cities. One study found that ragweed pollen could be seven times higher in a city that’s 3.6 degrees warmer and has 30% more carbon dioxide than nearby rural areas — a common occurrence due to the urban heat island effect.

Tip

To find out what type(s) of pollen you are allergic to, you can take a doctor’s test or follow this quiz from Kleenex.

Hawaii and Mississippi have the worst indoor allergies

Jackson, Miss., is the worst city for pet dander and dust; Reno gets off lightly.

Indoor allergens include pet dander, dust and mold. Pet dander is the dead skin cells shed by furred or feathered pets, which are light enough to become airborne and cause irritation, so we factored local pet ownership rates into our severity rating. We also factored in average temperature, rainfall, humidity and the age of homes since these are variables that can intensify the presence and effects of dust mites and mold spores.

With their humid climates and higher-than-average pet ownership rates, Hawaii and Mississippi are the worst states for indoor allergies, with an average severity rating of 7.94 and 7.51 out of ten, respectively.

Map of the United States showing the best and worst states for indoor allergies in 2025 and beyond, based on the average age of homes, pet dander levels and particular atmospheric conditions that can lead to mold and dust mite growth.
Map of the United States showing the best and worst states for indoor allergies, based on the average age of homes, pet dander levels and particular atmospheric conditions that can lead to mold and dust mite growth.

The Hawaiʻi State Department of Health notes that dust mites and mold can trigger severe asthma attacks, and 104,400 (9%) local adults and 30,000 (10%) children suffer from asthma in Hawaii. Among Native Hawaiians, asthma affects 15% of adults.

Alongside Mississippi, the hot southern states of Arkansas, Louisiana and Alabama are among the five worst places for indoor allergies. Temperatures may be high to the west in Arizona and California, but the southwest is experiencing a 25-year megadrought, with the soil now drier than at any time over the past 1,200 years. Although a side effect of this ongoing disaster may be to reduce the chance of specific indoor allergens, the drought blights the air through the increased incidence and severity of wildfires.

Ranking of the five best and five worst U.S. cities for indoor allergies in 2025 and beyond, based on the average age of homes, pet dander levels and particular atmospheric conditions that can lead to mold and dust mite growth.
Ranking of U.S. cities by indoor allergy levels, based on an indoor allergen severity score that accounts for pet dander, dust, mold and other indoor allergy triggers.

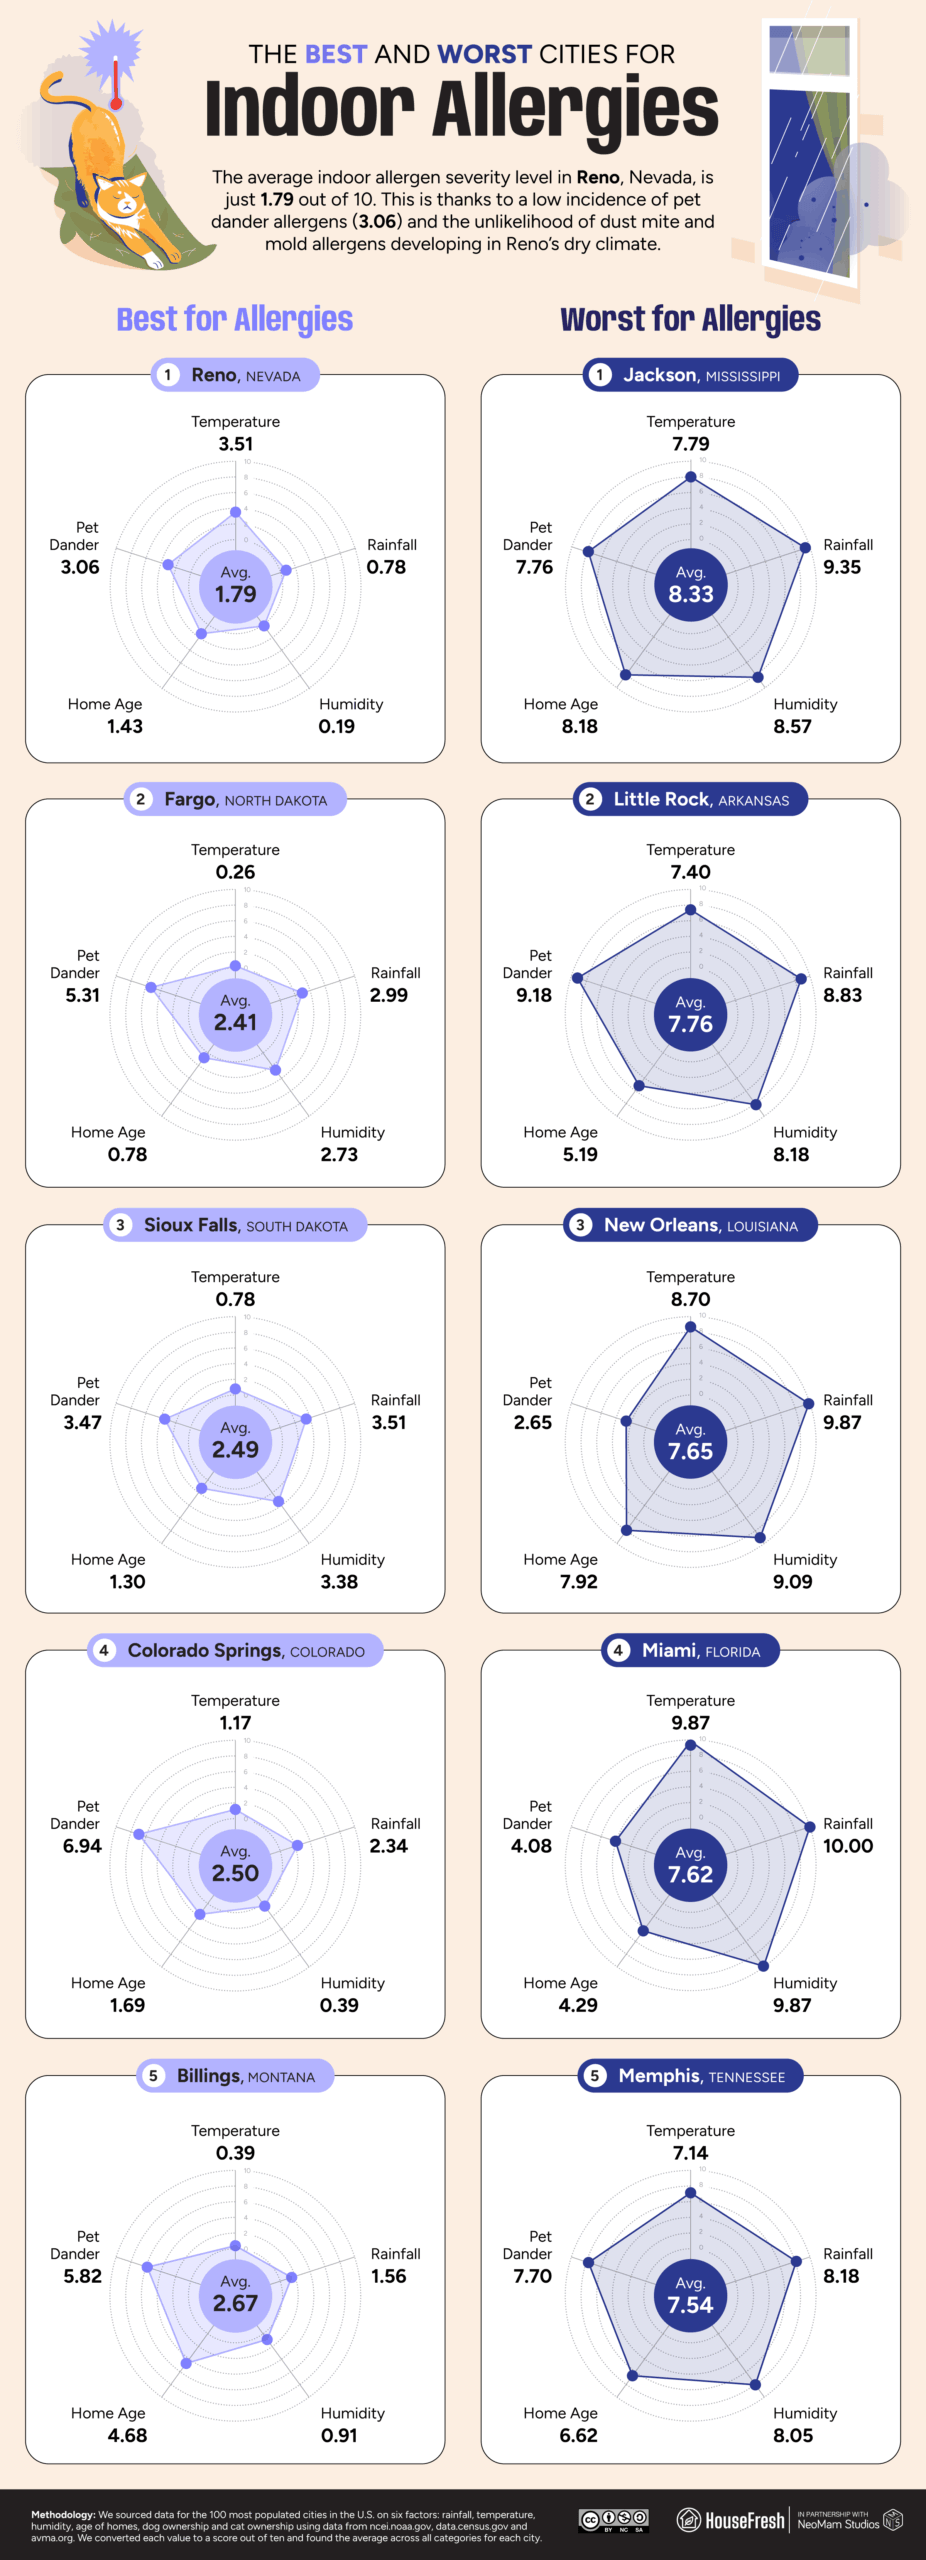
The city with the worst indoor allergies is Jackson, Mississippi, with an average severity of 8.33 out of ten based on high scores across all categories. While it may be hotter, rainier and more humid in New Orleans, the relatively low pet ownership rates here keep the average overall severity score at 7.65.

Reno, Nevada, is the best city for indoor allergies, with a severity rating of just 1.79 out of ten — significantly lower than any other major city. That might be a good reason to stay inside since Reno’s outdoor allergens are far more prevalent, and Reno has the fastest-expanding allergy season of any major city.

Find the allergy severity of any state or major city

But note that sometimes going somewhere new can be enough to trigger an allergy.

As the example of Reno — with a very low indoor allergy rating but outdoor severity of 5.33 — shows, no area is completely spared the effects of common allergens. But forewarned is forearmed, and you can check the full breakdown of each state and major city’s severity ratings overall and for each variable using our interactive chart.

Do note that moving to escape allergens may expose you to unfamiliar ones, and even if you stay in the same place, you may begin to suffer from new allergies.

“If you move to a new area, you may be impacted by new types of vegetation that grow in that environment. For some people who are experiencing new onset allergies, it is because changes in temperature and precipitation patterns allow plants and trees to grow in places they didn’t before.”

Dr. Neelu Tummala, a clinical assistant professor of otolaryngology at NYU Langone Health

As such, efforts to identify the allergens that affect you, reduce your exposure to them and prepare to remedy reactions as they occur may be the best way to minimize the irritation and even danger of indoor and outdoor allergies.

TIPS FOR MANAGING YOUR ALLERGIES
  1. Consider getting an air purifier with a high-quality particle filter and good air cleaning performance at quiet fan speeds, so you can run it inside your home 24/7. Check out our top picks for tackling airborne allergens.
  2. Close doors and windows when high pollen counts are forecasted, and don’t hang laundry outside to prevent bringing pollen back indoors.
  3. Avoid going outside when someone is mowing the lawn or trimming hedges and trees.
  4. Avoid using a dry cloth or feather duster — opt for a microfiber cloth or a damp rag instead, as it will help trap most dust without recirculating it into the air.
  5. Hoover carpets, upholstered furniture and curtains regularly with a HEPA filtered vacuum cleaner.
  6. Hot wash your bedding once a week and once dry, give it 10 minutes on high heat in a tumble dryer to eliminate dust mites.
  7. Regularly brush your pet to reduce the dander in their fur before it is released into the air.
  8. Try to create pet-free zones around your home (even if just your bedroom!) so you can reduce your contact hours with dander.
  9. To reduce your exposure to mold, keep your home dry by fixing leaks, venting your clothes dryer to the outside, and using insulation and storm windows.

Methodology

To identify the U.S. states and cities that are best and worst for people with allergies, we analyzed a series of metrics for outdoor and indoor allergens, respectively.

For the outdoor rankings, we sourced 2025 data for three allergens (tree, grass, ragweed) from the pollen.com website. We calculated the average annual severity of these allergens for over 970 cities across the U.S. and calculated the average values by state by aggregating cities. 

For the indoor rankings, we considered six factors for all states and the top 100 most populated cities in the U.S.:

Dust mites and mold allergens thrive in warm, wet, humid climates. Hence, rainfall, temperature and humidity were considered as key factors that can promote mold and dust mite growth without intervention. Similarly, older homes are typically worse for mold owing to poor ventilation and insulation.

Dog and cat ownership rates were considered as indicators for the prevalence of another key indoor allergen: pet dander.

The final outdoor/indoor index scores were created by assigning values for each individual factor based on percentiles, assigning 10 to the highest value (worst score, relative to U.S. allergen levels). The further down the factor is located in the percentile distribution, the closer its assigned value is to 0 (best score). Then, to obtain an overall score, we calculated the average score across all factors for each ranking (i.e., the average score across all indoor allergen factors).

The worst states and cities for air quality

Header Air Quality Report

Few factors influence your health and sense of well-being than having clean, fresh air to breathe.

Humans have worried about the effects of air pollution on health since at least the time of Hippocrates. But industrialization and the spread of cars and cigarettes have made good air hard to find — and the growing reach and regularity of wildfires have become the leading cause of worsening air in America in recent times.

Of special concern today is PM2.5 or fine particulate matter: “small droplets of liquid, dry solid fragments, and solid cores with liquid coatings” with a diameter of no more than 2.5 micrometers, which is less than 1/30th of a strand of human hair.

These particles mostly come from burned fuel and firewood. Even one day of exposure to air with high PM2.5 levels can lead to bronchitis, asthma attacks and other heart and lung issues. Long-term exposure has been linked with slower lung function growth in children and shorter lifespans for all affected.

For this report, we used the latest annual PM2.5 data to identify the states and large U.S. cities with the best and worst air quality.

We sourced the average concentration of PM2.5 (fine particulate matter) in the air from IQAir for U.S. towns and cities in 2024. To calculate the average PM2.5 concentration in each state, we weighted cities within a state based on land area (i.e., bigger cities contributed more to the average).

Key findings

  • Georgia is the state with the worst air quality, at an average concentration of 8.9 µg/m³ (micrograms per cubic meter of air).
  • Hawaii (3.4 µg/m³), Alaska (3.6 µg/m³) and Rhode Island (3.6 µg/m³) have the best air quality.
  • Nine of the ten large cities with the worst air are in California, led by Ontario (14.3 µg/m³).
  • The large U.S. city with the best air quality is Anchorage, Alaska (3.1 µg/m³).

Georgia has the worst PM2.5 levels in America

Southern states fare worst for air pollution, but Idaho is also among most polluted.

First, we identified the states with the best and worst air. Of the six states with an average PM2.5 concentration of greater than 8 µg/m³, four are adjoining states in the South, with Georgia nearby in the Southeast. Idaho (8.7 µg/m³), in the Northwest, has the third-worst air.

Things look a lot clearer in Hawaii (3.4 µg/m³) and Alaska (3.6 µg/m³), while the Northeastern states of Rhode Island (3.6 µg/m³), Maine (5.0 µg/m³) and Vermont (5.0 µg/m³) join Washington (4.8 µg/m³) among those with a PM2.5 score of 5 µg/m³ or less.

01 The Best and Worst State for Air Quality scaled
U.S. map showing the best and worst states for air quality, based on annual average PM2.5 concentration

Georgia (8.9 µg/m³) has the worst air overall. Wildfires within state boundaries and from neighboring states are an increasing issue. But the grim irony is that the controlled “prescribed burns” that are used, in part, to mitigate the risk of uncontrolled wildfires are themselves associated with an increase in mortality.

The hot Georgia weather also compounds road emissions. Danna Thompson, an advocacy director at the American Lung Association, notes that when “heading into higher temperatures in the summer in the South, we certainly really encourage people to consider taking and using other forms of transportation, whether it’s biking, walking, taking trains because cars and the trucking industry do impact air quality.” Meanwhile, in April 2025, President Trump exempted Georgia Power’s two coal-firing plants, among dozens nationwide, from emission regulations.

California cities among the best and worst for clean air

Nine out of the 10 most polluted large cities are in California, but Daly City is among cleanest.

Next, we looked at the cities with a population greater than 100,000 to identify the worst and best for air quality. California suffers the best and worst of it: nine of the ten large cities with the highest concentration of fine particulate matter in the air are in the Golden State, but so are five of the ten with the lowest PM2.5 levels.Just four U.S. cities have a PM2.5 score of below 4.0 µg/m³. Daly City, California, scores 3.8 µg/m³, but the city with the best air is Anchorage, Alaska (3.1 µg/m³). In theory, Alaska’s cold climate allows air pollution to linger at ground level, creating disproportionate pollution levels compared to the state’s relatively low population and modest industrial footprint. However, on balance, the state’s low emissions and local efforts to reduce pollution mean that average PM2.5 levels in Anchorage remain low.

02 The US Cities with the Best and Worst Air Quality scaled
Ranking of the cities in America with the best and worst air quality, based on annual average PM2.5 concentration

In California, highly industrialized areas such as the San Joaquin Valley have historically exceeded Environmental Protection Agency restrictions on air quality, while researchers have shown urban planning to have disproportionately blighted minority communities with excessive vehicular traffic and associated air pollution. By comparison, the quiet suburban city of San Jose is relatively non-industrial, while its position on the peninsula cushions it from higher concentration areas.

“[C]entralized, state-level regulation of air quality in California’s San Joaquin Valley is the only way significant progress on air quality will ever occur,” says Cade Cannedy, a former air quality academic and present Director of Programs at Climate Resilient Communities. “If you really want things to improve, you have to take power away from the polluting industries who are collaborating to stop progress on this front.”

Kansas City is worst Missouri city for fine particulate matter

Mission is the worst in Texas — but escapes accountability on a technicality.

Finally, we identified the city with a population of over 10,000 people with the best and worst air in each state.

Shafter, California (16.1 µg/m³) and Mission, Texas (12.4 µg/m³) are the stand-out cities for bad air by this metric. Shafter has been designated as “at special risk of dust impacts” from harvesting. Local farmers can access 75% subsidies on newer, low-pollution machinery to reduce the dust impact of local almond farming, which can be particularly high during hot, dry spells.

03 The Worst Place for Air Quality in Every State scaled
Map of the U.S. showing the most polluted city or town in every state, based on annual average PM2.5 concentration

The Texas Commission on Environmental Quality (TCEQ) recently excused Hidalgo County, where Mission is situated, from its failure to keep to federal air standards, saying that a “significant percentage of the trajectories of pollution were from the southerly and/or southeasterly direction, indicating significant international impact.” However, critics have argued that since the standards are primarily in place to keep people safe, such exemptions should not be made, as they discourage efforts to offset ‘excusable’ sources of air pollution.

Waimea, HI, has the best air quality in the country

Gulfport is the least polluted city in Mississippi but PM2.5 concentrations still exceed WHO guidelines

The Mississippi city with the best air is Gulfport (7.6 µg/m³) — however, this is the worst “best air” of any state. Huntington, West Virginia, is not far behind with 7.5 µg/m³.

04 The Best Place for Air Quality in Every State scaled
Map of the U.S. showing the least polluted city or town in every state, based on annual average PM2.5 concentration

Among cities with the cleanest air in each state, Waimea, Hawaii (1.7 µg/m³), Troutdale, Oregon (2.5 µg/m³) and Seaside, California (2.5 µg/m³) stand out as the cleanest of all. Hawaii is vulnerable to a peculiar form of fine particulate matter: volcanic smog, or “vog” — “a hazy mixture of SO2 gas and aerosols (tiny particles or droplets) which are primarily sulfuric acid and other sulfate (SO4) compounds.” However, the relative isolation of the Hawaiian Islands and the influence of trade winds help to keep the air relatively clear.

131 million Americans breathe bad air

The air quality divide is palpable, but things are getting worse for all.

The American Lung Association has found that nearly 40% of Americans, or 90 million people, live in places where the air quality fails to meet recent Environmental Protection Agency standards, while 131 million live with unhealthy levels of ozone or particle pollution.

These areas can be divided by location but, in many cases, also by socio-economic conditions. But cities known for their relatively clean air are also suffering from a decline in standards. And the rollback in environmental legislation, along with the increase in wildfires, means many can expect to enjoy fewer good air days as summer — and the planet — heats up.

METHODOLOGY

We sourced the average PM2.5 concentrations for 2024 as reported by IQAir’s air quality rankings. To calculate the average PM2.5 concentration by state, we weighted cities within a state based on land area (i.e., bigger cities contributed more to the average). To uncover the most and least polluted cities, we ranked cities with the highest and lowest average 2024 PM2.5 concentrations from those with a greater than 100k population. In order to find the best and worst places by state, we lowered the population threshold to 10k to determine the towns or cities with the best/worst air quality overall across each state.

How many cigarettes you’re indirectly smoking due to air pollution levels

A cigarette with smoke

Every day, the average adult inhales approximately 11,000 liters of air. But while getting outside and breathing in fresh air has numerous health benefits, the reality is that not all air is good for you. Airborne pollutants are one of the greatest sources of toxic exposure known to humankind and according to one estimate from the World Health Organization, air pollution contributes to seven million premature deaths worldwide every year.

Of special concern is fine particulate matter (PM2.5) — airborne particles from engines and other emissions that are less than 0.033 the diameter of a human hair. These particles make their way to the deepest parts of your lungs and can get into your bloodstream. Cigarettes emit ten times more PM2.5 matter than diesel car exhausts, according to a controlled experiment reported by Tobacco Control. But while quitting smoking reduces exposure to toxins and improves overall health, it is harder to avoid the toxins that pollute the indoor and outdoor air.

Air quality varies significantly around the globe, and in many parts of the world, the negative health effects of poor air quality are equivalent to smoking hundreds of cigarettes a year. To better communicate the health risks of air pollution, we used the latest data to calculate the number of cigarettes people around the world are indirectly smoking due to poor air quality.

We found the average PM2.5 concentration data in 2024 for the most populated cities in every country, according to data from IQAir.. Then, we used Berkeley Earth’s rule of thumb, that one cigarette approximates to 22 µg/m3 PM2.5 concentration. With this reference, we multiplied the result by 365 days to obtain the yearly number of cigarettes indirectly smoked in each location.

Key findings

Many cities with the worst air quality are in developing economies in the Middle East, Southeast Asia and Africa.

Delhi in India has the worst air pollution of any major global city — the equivalent of smoking 1,797 cigarettes per year.

The capital city with the best air is Nassau in the Bahamas, where PM2.5 levels are equivalent to smoking 38 cigarettes yearly.

Boise, Idaho, has the worst air of any major U.S. city — at the equivalent of smoking 171 cigarettes per year. Boise is followed by Fresno (169) and Los Angeles (168).

Breathing Delhi air is like smoking 1,797 cigarettes per year

The level of air pollution in the Indian capital is equivalent to smoking 35 cigarettes a week.

First, we sourced the average PM2.5 levels for every major city worldwide in 2024. These are measured in µg/m3 or micrograms per cubic meter of air. The 20 cities with the worst air all breathe the equivalent of at least 15 cigarettes per week. The worst air of all is India’s capital, Delhi, where average PM2.5 levels of 108.3 µg/m3 equate to 35 cigarettes per week or 1,797 per year.

Chart ranking 20 global cities by yearly cigarettes indirectly smoked due to air pollution in 2024, with Delhi highest at 1,797
Breathing the air pollution in Delhi in 2024 was equivalent to smoking 1,797 cigarettes a year — the highest among over 700 cities analyzed. This chart shows the top 20 cities where pollution equals the most indirect smoking.

Eighteen of the top 20 capital cities with the worst air are in Asia, and the other two are in Africa

To get a comprehensive global view, we narrowed our focus to the world’s capital cities.

Delhi has leaped to the top of the table in 2025 with more than twice the PM2.5 levels than in our 2024 report. Researchers have found that local humidity levels may have obscured the true level of particulate matter in Delhi’s air in previous years.

“The air is killing us all. The government is leaving us to die so that India can grow big. Every year more cars, more buildings, more rubbish, more factories, filling the air with filth – is that worth more than our lives?”

Hartosh Singh, local fruiterer

Chart showing top 20 capital cities where air pollution equals most cigarettes indirectly smoked in 2024
In 2024, air pollution in the capital of India exposed residents to the equivalent of smoking 1,797 cigarettes annually — the highest among capital cities in our study. This chart ranks the top 20 capitals by indirect cigarette exposure due to PM2.5 pollution.

The only non-Asian or -African capital city among the 30 capitals with the worst air is Sarajevo, Bosnia and Herzegovina, where the pollution is equivalent to smoking 511 cigarettes yearly. UNICEF reports that the effects of air pollution cost “over 21.5 percent of BiH’s GDP through lost work and school days, and healthcare costs.” The U.N. Environment Programme attributes Sarajevo’s poor air to “heavy traffic, poor spatial planning, solid-fuel based heating and natural factors are to blame for the poor air quality.”

Boise, Idaho, is America’s most air-polluted major city

And for some Californians, breathing local air is like smoking 169 cigarettes annually.

Next, we looked at the average levels of fine particulate matter in the air of America’s major cities.

Two of the three cities with the worst air are in California. Just 6.0% of adults smoke tobacco in California, but in Fresno, residents indirectly smoke the equivalent of 169 cigarettes per year, and in Los Angeles, that figure is 168. Local emissions policies have reduced the amount of fine particulate matter that Californians inhale by 65% in 25 years. However, an increase in the number and spread of wildfires has significantly reduced local tree cover, releasing carbon dioxide into the air and inhibiting the natural cooling of the local environment.

Chart showing top 20 major U.S. cities where air pollution in 2024 equals most cigarettes indirectly smoked by residents, led by Boise at 171
In 2024, Boise, ID topped the list of major U.S. cities for air pollution exposure — equal to smoking 171 cigarettes per year. This chart ranks the top 20 cities by indirect cigarette exposure from PM2.5.

We found that the city with the highest PM2.5 level is Boise, Idaho, where an average density of 10.3 µg/m3 means the equivalent of smoking 171 cigarettes per year for Boise residents.

The city is reeling from one of the worst wildfire seasons of recent years. On July 23, 2024, the city’s Air Quality Index (AQI) score reached 227 AQI, the first time it has crossed into the “very unhealthy” category in a quarter century.

“Unfortunately we’re downwind from a lot of the California and Oregon fires, so smoke not only gets funneled here, but it can get trapped in the valley.”

— Brittany Brand, director of Boise State University’s Hazard and Climate Resilience Institute

Liverpool’s air is like smoking 171 cigarettes per year

The Merseyside capital is UK’s worst city for PM2.5, but southern coastal cities also suffer.

Finally, we looked at the air pollution in every UK city to determine the 20 cities with the worst air.

Along with traditionally industrial cities with dense urban centers, such as Manchester and Liverpool, there are a number of southern coastal cities, such as Worthing, Portsmouth and Bournemouth. In Portsmouth, where PM2.5 levels are equivalent to smoking 126 cigarettes per year, the council reports deaths attributable to fine particulate pollution to be higher than the England average most years since 2010.

Chart showing top 20 UK cities where air pollution equals most cigarettes indirectly smoked in 2024, led by Liverpool, Worthing and Northampton.
In 2024, Liverpool topped the list of UK cities for air pollution exposure — equivalent to smoking 171 cigarettes per year. This chart ranks the 20 UK cities where PM2.5 pollution equals the most indirect smoking.

Some of these coastal towns are impacted by an influx of tourist vehicles in the summer months, and the air quality is also affected by salt particles from the sea and the industrial emissions of ports. They may also have been overlooked for reforestation programs.

In Bournemouth, motor vehicles are one of the biggest contributors to urban air pollution, compounded by a dense road network, outdated buses, and a lack of investment; a clean air zone has been proposed, but there are concerns over the economic trade-off.

Based in Hampshire, Safe Air Schools UK responds to challenges shared by schools nationwide:

This data highlights that Portsmouth — in our own county — ranks among the UK’s worst cities for PM2.5 with air pollution carrying the same health impact as smoking 126 cigarettes a year. Friends of the Earth have identified 15 schools in the city located in neighbourhoods that exceed World Health Organization air quality limits — twice.

Across Hampshire, sickness is the leading cause of authorised school absence, and the county exceeds the national average.

Clean air is not a luxury; it’s fundamental to children’s health, learning, inclusion and equitable access to education. We’re calling for practical, affordable action to make safe air a reality for all children in every classroom.”

— Nathalie Pearson, Safe Air Schools

The number of cigarettes in your local city’s air

Use our interactive table to check the pollution levels in over 700 global cities.

The decline in smoking over the past two decades has been one of the great public health achievements of the 21st century, but worsening air pollution has offset many of the expected gains in general respiratory health. An increase in wildfires, rising vehicle and industrial emissions and domestic wood-burning appliances make living in some of the world’s most populous cities the equivalent of smoking hundreds of cigarettes a year.

Many cities with the worst air pollution are in fast-growing, developing economies, while the cities with the cleanest air are wealthier in service-oriented economies. But the air quality in some of the most developed major cities also decreases the local life expectancy, much like smoking. You can use the interactive table below to search for your city and see the number of cigarettes you effectively smoke each year due to air pollution.

Air pollution is one of the greatest threats to human health in the world and kills more people each year than tobacco, car accidents or diabetes. Respiratory health has become a major focus in public health since the COVID-19 pandemic, and smoking rates have fallen considerably over the past several decades.

For a complete picture of health, however, it is essential to know the respiratory impacts of the air we breathe daily. Do you know how many cigarettes you are indirectly smoking due to air pollution?

METHODOLOGY

To find out how many cigarettes are smoked indirectly due to air pollution around the world, we found the average 2024 PM2.5 concentration data for the most populated cities in every country on https://www.iqair.com/.

We then used Berkeley Earth’s rule of thumb that one cigarette approximates to 22 µg/m3 PM2.5 concentration. With this reference, we divided each city’s average PM2.5 level by 22 and then multiplied it by 365 days to obtain the yearly number of cigarettes indirectly smoked in each location.

The data is correct as of April 2025.

Dry air capitals: The cities with the driest air in the world

Header The Global and American Cities With the Driest Air

“How humid will it be today?” A common question for folks around the world to ponder as they plan their day since humidity can affect everything from our hair to our energy levels.

Forecasters measure humidity most commonly by looking at a day’s relative humidity, which considers the amount of moisture present in the air relative to the temperature.

However, the most reliable indicator of how dry or humid a day will feel is the dew point, the temperature at which your sweat evaporates and you begin to feel cool. Lower dew point temperatures feel dry, while higher dew point temperatures feel more humid. 

Using this metric, we previously identified the cities across the globe that feel the most humid. But we couldn’t help but wonder about those cities at the other end of the scale and ask: where in the world do locals live with uncomfortably dry air the most?

To find out, we used Weather Spark data to count the number of “dry air days” (days that had a dew point of 13°C (55°F) or below) that over 14,000 global cities and 5,000 U.S. cities experienced in 2023. Read on to discover the dry air capitals in the U.S., on every continent and across the globe. 

Key findings

  • Reno in Nevada experiences more dry air days (363.91) per year than any other U.S. city.
  • In South America, seven cities (including La Paz in Bolivia) count a full 365 days of dry air per year.  
  • In Europe, Reykjavík in Iceland has the driest air on the continent (364.52 annual dry air days), but Norway claims another four of the top 10
  • In Oceania, Australian cities dominate our top 10 dry air ranking — but Dunedin in New Zealand counts the most dry air days of all (352.51)

The dry air capitals of the United States

Reno in Nevada has more dry air days per year than any other U.S. city

We first wanted to find out which cities in the U.S. have the driest air using the number of dry air days they experienced in 2023 as a proxy. Reno in Nevada comes top overall with 363.91 dry air days per year, a count just two days short of a full year of uncomfortably dry air. 

02 The Large Cities With the Driest Air in America

After that comes Sparks, a city just a stone’s throw from Reno, which counts 363.78 dry air days annually. Situated on the western edge of the Great Basin, both cities are blocked from the moisture of the Pacific Ocean to the east by the Sierra Nevada mountains, an effect known as a rain shadow.

03 The City With the Driest Air in Every State

Our map above reveals the city in every state with the highest count of dry air days per year. Among the country’s driest cities are Laramie in Wyoming and Butte in Montana, both of which count close to a full year (364 days) of dry air. In contrast, Mililani Town in Hawaii only experiences 11 dry air days per year. High humidity tends to be comfortable in Hawaii due to the cooling effect of the state’s trade winds.

The dry air capitals of the world

Two South American cities experience a full 365 days of dry air

Next, we mapped the city in every country with the driest air of all. Two cities on the map stand out as having experienced a full year of dry air in 2023 — Cusco in Peru and La Paz in Bolivia. Both of these cities are situated on the cusp of the Atacama Desert, one of the driest regions on the planet. 

Even countries we might typically think of as more humid have their own dry air hotspots. In the UK, for example, Dundee experiences 344.9 dry air days per year. It’s also the sunniest city in Scotland. 

“It is all down to the geography of Scotland,” explains Grahame Madge, a spokesman for the Met Office. “Most of the weather comes in from the Atlantic, with moist air being forced up toward the western highlands … a lot of the rain is released in the western regions, by the time the air makes its way over to the lower regions of the east coast, it is drier. Dundee is also sheltered by the Cairngorms and other high regions, meaning that it is generally warmer.”

The dry air capitals of North America

The U.S. claims more than half of North America’s top 10 cities for dry air

While North America spans 23 countries from the polar reaches of Canada to Cocos Island in Costa Rica, over half of the top 10 cities on the continent with the driest air can be found in the U.S. Reno leads with 363.91 dry air days per year. But Bend, Oregon (363.66 annual dry air days), Boise, Idaho (361.22 annual dry air days), and Anchorage, Alaska (360.93 annual dry air days), also feature. 

05 The Large Cities With the Driest Air in North America

Outside of the U.S., Calgary in Canada ranks with a count of 359.86 dry air days per year. Calgary is blocked from the moisture of the Pacific Ocean thanks to a rain shadow created by the Rocky Mountains.

The dry air capitals of Europe

Iceland’s capital city Reykjavík has the driest air of any European country

Turning our attention to Europe, we found that Reykjavík in Iceland experiences more dry air days (364.52) per year than any other city on the continent. Thanks to the effects of the Gulf Stream, Iceland has a mild maritime climate, but being so close to the Arctic Circle, it’s also vulnerable to very cold and dry Arctic air masses.

06 The Large Cities With the Driest Air in Europe

Meanwhile, Norway claims another four of the cities in Europe with the driest air. Leading the pack are Trondheim and Drammen, both of which experience 351.99 dry air days per year. Like Iceland, Norway is vulnerable to cold, dry Arctic air because of cold air’s reduced capacity to hold onto moisture. “In some places, Arctic air is as dry as air in the Sahara Desert,” comments the National Snow and Ice Data Center.

The dry air capitals of Oceania

Dunedin in New Zealand experiences more dry air days annually than any other city in Oceania

In Oceania, Dunedin in New Zealand counts more dry air days (352.51) per year than any other country. Dunedin is the principal city of the Otago region, of which the Central Otago district is the driest of any in the country, receiving less than 400 mm of rainfall a year. The next city in New Zealand featured in our ranking is Christchurch, which sees 327.64 dry air days annually. 

07 The Large Cities With the Driest Air in Oceania

But most of the dry air capitals of Oceania are in Australia. Hobart leads the pack, a Tasmanian city where locals experience 346.60 dry air days a year. The air is dry here because the neighboring Mount Wellington saps the moisture from the prevailing winds before it can descend into the city. Ballarat (345.29 dry air days a year) and Adelaide (330.61 dry air days a year) on the mainland come next. 

The dry air capitals of South America

Peru claims five of the top 10 dry air capitals in South America

South America is a stand-out continent when it comes to dry air: seven cities (five of them in Peru) counted a full 365 days of dry air in 2023, with the remaining three experiencing just over 364 days.

08 The Large Cities With the Driest Air in South America

Most are either in or on the edge of the Atacama Desert, an extremely arid region thanks to the cold Pacific Ocean’s moisture-sapping effects on the air. So dry is the Atacama Desert that Calama (364.67 dry air days a year) in Chile experienced no rainfall at all between 1570 and 1971. Meanwhile, Quito (364.65 annual dry air days) is the only South American dry air capital to be found in Ecuador. The city is situated close to the earth’s equator, lending it a consistently cool climate. 

The dry air capitals of Africa

Aswan in Egypt counts more dry air days per year than any other African city

Over in Africa, Aswan in Egypt takes the title of having the driest air of any city on the continent, counting 356.58 days of dry air in 2023. Situated in the south of Egypt, Aswan is one of the world’s driest cities, receiving only 3 mm of rain a year.

09 The Large Cities With the Driest Air in Africa

After Aswan comes Béchar — one of four Algerian cities in our ranking — with a count of 353.18 annual dry air days. It’s no wonder the air in Algeria is so dry, as the Sahara desert spans nearly all of the country’s territory. The furthest south of the continent’s dry air capitals is Addis Ababa, Ethiopia’s capital and largest city (339.12 annual dry air days). At 7,726 ft above sea level, the air here is thinner and less capable of holding moisture than a city at a lower altitude. 

The dry air capitals of Asia

All of Asia’s dry air capitals are in Iran, led by Bīrjand in the east of the country

As the biggest continent on the planet, almost every known climate occurs somewhere in Asia. Despite that, all ten of its dry air capitals can be found in just one country: Iran

10 The Large Cities With the Driest Air in Asia

Bīrjand comes out on top with 364.77 dry air days a year, followed by Yazd and Shāhreẕā, both of which count 364.76 annual dry days. Most of Iran has an arid or semi-arid climate, experiencing little rainfall and, as a result, water supply shortages. The winters can also be very cold here, a weather condition that causes dry air thanks to cold air’s inability to hold onto moisture well. 

Four ways to humidify a room without a humidifier

While we can’t control the outdoor climate and weather where we live, we can alleviate the problem of dry air in our own homes. Humidifiers are a great solution, but if you can’t get one, here are some things you can do to tackle the problem of dry air indoors. 

  1. Air dry your laundry inside. Instead of throwing your clothes in the dryer, hang them up indoors on a clothes horse or something similar. Not only are you saving on energy bills, but as the clothes dry, the moisture evaporates into the air and humidifies your home. 
  2. Leave the door open after showering. Once you’ve finished having a shower, don’t let all that steam go to waste: open your bathroom door so the moisture in the air can circulate through your house. 
  3. Place a container of water near a source of heat. Fill a container with water and leave it on a radiator or in direct sunlight so that the water evaporates into the air. 
  4. Get a houseplant. Some houseplants add moisture to the air through a process called transpiration. Previously, we found that the best you can buy is an Areca palm tree, which humidifies your air while removing chemical toxins.

As we’ve explored, dry air can trigger a range of health conditions and impact the health of your home’s fixtures and furnishings, too. Introducing more moisture to indoor air by investing in a humidifier or using these tips can relieve uncomfortable physical symptoms and protect your home from damage.

Here’s how you can tell if the air in your home is particularly dry and just some of the ways it can affect someone’s health.

01 What is Dry Air And Why Does it Matter

SOURCES

We began our research by retrieving humidity data for large cities (with a population of at least 100k) in every country and U.S. state from Weather Spark. This gave us data for a total of 14,657 global cities and 5,175 U.S. cities. 

This enabled us to identify the top cities by country, by continent and in the U.S. with the driest air based on the number of days in 2023 they had a dew point of 13°C (55°F) or below. The dew point defines humidity comfort levels. Lower dew point temperatures feel drier, and higher dew points feel more humid. The dew point better represents how humid a city feels than relative humidity. This is explained here and here.

For our U.S. state map, we lowered the threshold to consider cities with a population of at least 25k. 

The price of clean indoor air in every country

Header The Price of Clean Indoor Air in Every Country and State

The home should be the safest place a family can be. But no lock and key can keep out the effects of air pollution. Aside from the unbound nature of motor and industrial pollution, one-third of the world’s population uses air-polluting stoves and fuels to cook meals. This latter pollution alone causes around 3.2 million deaths each year, including nearly a quarter of a million children under five.

While deaths of this nature are in slight decline, air pollution from fossil fuels and industrialization continue to take a bigger toll. And while the effects are more pronounced in other parts of the world, the U.S. is no exception. Americans spend around 90% of their time indoors, where pollution is often up to five times as dense as outdoors.

But another level of inconsistency exists in the cost of coping with bad air. The price and accessibility of air purifiers and electricity vary considerably around the world. To find where it’s cheapest or least affordable to keep indoor air fresh, the team here at HouseFresh identified an affordable, effective and widely available air purifier and calculated the cost of buying and running it in every country for a year.

We found the cost of buying or importing three Levoit Core 300 air purifiers in every country (with these units, one could filter the air of a three-room, 680-square-foot home). And then, we added the local cost of running these three units 24/7 for 365 days a year for each territory by using the unit’s energy consumption rate and the average local electricity prices.

Key findings

  • Clean indoor air is most expensive in Ghana, where it costs $1,852 to maintain clean air in a home for one year.
  • Keeping the air clear of pollutants at home is the cheapest in Thailand ($434/year).
  • The U.S. has the cheapest clean indoor air in North America ($482/year).
  • In the UK, keeping the air clean in a home for one year could cost up to $815 (£655).

How much does each country pay for clean air at home?

We found that six of the ten countries with the most expensive clean air are in Africa and two (Cambodia and Afghanistan) are in Asia. Moreover, 23 of the 30 most expensive countries are in either Africa or Asia. 

However, Asian countries also comprise eight of the ten lowest-cost markets for fresh household air. The United States ($539) and Serbia ($515) are also among the ten cheapest spots.

01 The Price of Clean Indoor Air in Every Country

The most expensive place of all is Ghana in Africa. Here, it costs $1,852 for one year of clean air; that’s 3.8 times as expensive as in the U.S. This is mainly due to the cost of buying the air purifier in the first place. Of the ten most expensive countries, Burkina Faso and Belize stand out for earning their places with high energy costs rather than expensive hardware.

As our next graphic illustrates, Ghanaians are also coping with high levels of PM2.5 — fine particulate matter. This matter can come from industrial, automobile or domestic sources and consists of particles that are under 1/30th the diameter of a strand of human hair. Desert dust is a particular issue during the dry season in Ghana, but motor vehicles are also to blame. A policy shifting car users significantly towards public transport, walking and cycling could save up to 5,500 premature deaths every year.

02 Air Pollution vs Price of Clean Indoor Air

Iraq has the world’s highest PM2.5 levels and is among the 26 most expensive countries for clean indoor air. Iceland has the lowest PM2.5 levels (from countries with available data). However, volcanic activity can make matters worse — spewing ash and gasses that break down to PM2.5 scale within a month. Unfortunately, we found that Iceland also is one of Europe’s most expensive countries for air purifiers.

The most and least expensive countries for indoor clean air by continent

The annual cost of purifying the air at home varies by at least $600 on every continent. Our following maps reveal the cost disparity across the Americas, Europe, Asia and Africa.

North America

The Caribbean countries of Belize ($1,534) and the Cayman Islands ($1,300) stand out as North America’s most expensive markets for home air purification. The set-up costs are over $100 higher in Belize, but Cayman Islanders pay $0.42/ kWh for electricity — nearly twice Belize’s rate ($0.22).

Fortunately, Belize has relatively low PM2.5 levels of around 5.6 μg/m³. By comparison, the North American country with the highest PM2.5 levels is Mexico, with Mexico 19.5 μg/m³.

03 The Most and Least Expensive Countries for Clean Indoor Air in North America

The United States ($482) has the cheapest air purifier costs on the continent and the sixth cheapest globally. A decent purifier can cost as little as $100 in the U.S., although with electricity costing $0.17/kWh, the process isn’t as cheap as it might be. America’s PM2.5 concentration averages around 8.9 μg/m³.

The effects of air pollution in the U.S. are far from even. One study found that “the harmful effect of fine particulate matter on life expectancy is especially pronounced in states with both very high levels of income inequality and very large black populations.”

South America

We found three South American states with a four-figure price tag on that first year of clean indoor air: Argentina ($1,328), Colombia ($1,228) and Brazil ($965). Argentina suffers from particularly expensive set-up costs, while Colombian families pay around 3.4 times as much for electricity.

Particulate levels are notably higher in Colombia. Around 8% of deaths in Colombia are linked to water and air pollution, with parts of ​​the Aburrá Valley and the Bogotá towns of Puente Aranda, Carvajal and Kennedy among the worst affected.

04 The Most and Least Expensive Countries for Clean Indoor Air in South America

Venezuela ($554) is the cheapest South American country for clean indoor air. The country benefits from low set-up costs and modest electricity prices of $0.09/kWh. However, climate change-induced extreme weather events, illegal mining and deforestation contribute to an ongoing environmental crisis in the country.

Europe

Substantial energy costs and an air cleaner price that’s around twice or more that of the U.S. push several European countries into the four-figure area. Liechtenstein ($1,055) has the highest overall price for clean indoor air. This can be attributed to electricity costs of $0.51/kWh — the second highest in the world next to Ireland.

Sandwiched between Austria and Switzerland, Liechtenstein has a permanent population of just 40,000 people. Although Liechtenstein’s fine particulate levels are towards the lower end of the scale (8.3 μg/m³), levels of atmospheric ammonia — an agricultural byproduct — continue to outpace efforts at reduction.

05 The Most and Least Expensive Countries for Clean Indoor Air in Europe

The UK ($815) has the 14th highest price of clean indoor air in Europe. As with Liechtenstein, this is mostly due to phenomenally high electricity costs ($0.44/kWh – the 4th highest in the world). The UK’s PM2.5 levels slightly outstrip Liechtenstein’s at 8.9 μg/m³.

The UK government’s air pollution targets (10 µg/m³) are twice as high as the World Health Organization (WHO) recommends (5 µg/m³) – and the target is not set to be met until 2040. In 2020, nine-year-old Ella Adoo-Kissi-Debrah became the first person in the UK to have her cause of death listed as air pollution. She died from an asthma attack in 2013, having grown up just 25 meters from the busy South Circular Road in south-east London.

Asia

Countries across different Asian regions are among the world’s most expensive for clean indoor air. But the most expensive by a significant leap is Cambodia ($1,645). Cambodia has among the highest set-up costs in the world and not insignificant electricity rates of $0.15/kWh.

The Cambodian government launched a “Blue Sky Campaign” in 2023 and has reduced the number of wildfires while introducing cleaner fuels. The country’s rural population has long suffered from the effects of agricultural fires and waste incineration, and 95% of the rural population uses harmful cooking methods and fuels.

06 The Most and Least Expensive Countries for Clean Indoor Air in Asia

However, Asia is also home to some of the cheapest countries for clean indoor air. Home air conditioning set-up costs in the United Arab Emirates, Saudi Arabia, Thailand and Malaysia are among the lowest in the world, and with low-moderate electricity costs, too.

Thailand ($434) is the cheapest country in the world overall for clean indoor air. This is fortunate as the country suffers from severe air pollution, with over 10 million Thais seeking treatment for pollution-related illnesses in 2023.

Africa

Africa is home to the two most expensive countries for clean indoor air: Ghana ($1,852, see The price of clean indoor air around the world, above) and the Democratic Republic of the Congo ($1,801). Ghana is expensive primarily due to the cost of air purifiers, while Congo has the most expensive filters in our study.

Congo is Africa’s most polluted country. Air pollution alone reduces life expectancy in Congo by 2.9 years, compared to what it would be if the country met World Health Organization guidelines.

07 The Most and Least Expensive Countries for Clean Indoor Air in Africa

Despite ongoing poverty across much of Africa, there are no African countries among the cheapest in the world for clean indoor air. Africa’s cheapest countries are Algeria ($568) and Angola ($556), but there are 11 Asian countries that are cheaper, as well as the United States, Canada, Venezuela, Luxembourg and Serbia.

Angola has cheap purifier set-up costs and electricity at just $0.02/kWh. However, Angola’s cheap energy is available to only a few homes. Some 57% of urban homes and 90% of rural homes are not connected to the grid.

How to make your own air purifier

A decent, shop-bought air purifier will combine engineering know-how with dependable materials and expert awareness of the scientific and regulatory factors at play. But if you prefer to build your own hardware, or find yourself at home on a bad air day with no working purifier to hand, it isn’t too hard to put your own basic machine together. Here’s how.

  • Box fan
  • MERV 13 filter
  • Strong tape     
  • Scissors
  • Screwdriver

Step 1: Buy materials

The main things you might not have at home are a box fan, HEPA filters and strong duct or gaffer tape. Make sure the filters you buy are large enough to cover the whole fan without stretching past the edges.

Screenshot 2024 04 25 at 11.32.22 AM

Step 2: Remove the speed dial from the fan

Needless to say, make sure to unplug the fan before you start removing parts. Turn the dial to the fastest speed setting before pulling it off with your hand or pliers.

How To Make a DIY Air Purifier Remove dial

Step 3: Remove the front grill from the fan

With most box fans, you should be able to unscrew the grill — but if it’s molded, use metal cutters.

How To Make a DIY Air Purifier Remove Grill

Step 4: Stick the MERV 13 filter on

Place the filter carefully on the front of the fan and make sure there are no gaps around the edges. Stick it down with the duct tape.

How To Make a DIY Air Purifier Attach

Step 5: Switch it on

The fan will suck air through, catching pollutants in the HEPA filter. You should change this filter at least twice a year.

How To Make a DIY Air Purifier Kitchen

Tip

If you want to build your own DIY air purifier, you can find more detailed instructions here.

The increase in wildfires and other air pollutants makes an air purifier more than an annoying expense — they are an essential part of the modern home. That’s why it’s important to ensure you’re getting the best one for your needs (for example, one that deals with construction dust well) and that can keep your indoor air as clean as possible for the minimum necessary price.

SOURCES

To determine the cost of clean indoor air worldwide, we calculated the cost of buying and running three Levoit Core 300 air purifiers (with two filter changes per unit) for a year in every country.

To research the cost of Levoit 300 units and filters, we first sourced prices for countries that Levoit operates in and hence could order directly from their website. For other countries, we sourced prices from local popular online marketplaces. For the remaining countries (particularly the African countries), we manually gathered data on the cost to import a Levoit Core 300 air purifier using local importers.

The cost to run these three units 24/7 for 365 days a year was calculated by factoring in energy consumption (35.5 watts per hour at speed level 3) and the average electricity prices in every country, sourced from globalpetrolprices.com.

These prices are in USD and are correct as of April 2024.

We decided to use the Core 300 for this research because it is a widely available air purifier (with a significant CADR of 145 CFM) that we can confidently say will be able to clean the air in rooms as large as 219 sq. ft. According to the performance tests we conducted when reviewing the Levoit Core 300, this is one of the best-performing low-priced air purifiers available on the market right now.

We accounted for three Levoit Core 300 units in order to cover an entire household, guaranteeing clean air in important areas such as the kitchen (where cooking generates particulate matter), the bedroom (where having an air purifier can remove allergens and improve sleep) and the living room or other living areas (where air purifiers can remove pet hair, dust, pollen, allergens and reduce the risk of exposure to airborne viruses).

The countries and states most concerned about indoor air quality

Header Air purifier capital

It’s easy to think that air pollution is only a problem for smog-filled cities, but the sad truth is that air pollution is all around, with one study finding that 99.82% of the planet’s land is exposed to unsafe levels of particulate matter 2.5 (PM2.5). Depending on where you live, your local air quality might be negatively affected by factors like local industry, heavy traffic and even wildfires.

Getting home might seem like a breath of fresh air compared to the outside, but unfortunately, there can be allergy-triggering pollutants there, too, like pet dander, dust, mold spores and harmful gasses like radon and tobacco smoke. With the average American spending 90% of their time indoors, it’s no wonder that the EPA calls indoor air pollution one of the top five environmental risks to public health.

It’s a pressing issue, but how much of a concern is indoor air quality across the U.S. and around the world? And is that concern growing at all? Guided by online searches for air purifiers — which work by removing tiny particles and odors from the air — HouseFresh went to find out. 

We recorded the average monthly Google search volume in 2023 for “air purifiers” (translated into the local language where applicable) in 150 countries and in every U.S. state. For each country and U.S. state, we then calculated how often air purifiers are searched for locally per 100k of the population (i.e., the higher the search volume, the higher the concern for indoor air quality). To track the change in indoor air quality concerns, we then calculated the % change in monthly search volume between 2018 and 2023 (2022 and 2023 for U.S. states).

KEY FINDINGS

  • Sweden is the most concerned country about indoor air quality: an average of 168 monthly online searches for air purifiers are made per 100k people.
  • But Croatia has gotten more concerned over time: between 2018 and 2023, average monthly searches increased by +507%.
  • In the U.S., Illinois is the most concerned state about indoor air quality, with an averageof 98.2 online searches for air purifiers made per month per 100k people. 
  • New Hampshire has seen concerns about indoor air quality increase the most over time: between 2022 and 2023, online searches for air purifiers jumped by +29.7%.

Sweden leads as the most concerned country about indoor air quality

Our map below reveals the countries that are most concerned about indoor air quality, based on the average monthly number of online searches carried out for air purifiers per 100k of the population. Sweden comes top, with an average of 168 monthly searches made. Locals needn’t be as concerned as in other countries: outdoors, the Nordic country’s air is among the cleanest of any country in the world (based on PM2.5 levels), and looking indoors, Sweden has Europe’s lowest proportion of smokers

01 Air purifier capital world map

Among the other most concerned countries is Australia (138.7 searches), where bushfires happen regularly. During bushfires, locals are often advised to keep their windows and doors sealed to prevent smoke from getting into the house. But one government report cites that — depending on the age and quality of a house — these actions only offer a level of protection between 12% to 76%. Air purifiers in these homes would offer extra protection from harmful airborne particles.

The United States is not so worried about air quality (39.7 searches), despite over a third of Americans living somewhere with unhealthy levels of air pollution. 

02 Air purifier capital countries

Croatia leads in as having seen the biggest year-on-year increase (+507%) between 2018 and 2023 in searches for air purifiers. Perhaps locals are eager to control the air they can, given that Croatia’s average PM2.5 concentration in 2022 was 4.7 times the WHO’s guideline value.

Illinois residents are the most concerned about the air quality indoors

In the U.S., Illinois ranks as the most concerned state about indoor air quality, with 98.2 online searches for air purifiers carried out per month for every 100k people. It’s no wonder that air quality is a concern for Illinois residents: in 2023, the Chicago-Naperville, IL-IN-WI area ranked among the most polluted cities in the country for ozone and year-round particle pollution. 

03 Air purifier capital states map concerned

Massachusetts comes next with 97 online searches per 100k people, where air pollution is responsible for an estimated 2,780 deaths a year. Other states in New England also place highly: Rhode Island, New Hampshire, Vermont and Connecticut. It could be that locals are reacting to last year’s localized increase in outdoor air pollution due to wildfires in Canada; wildfire smoke can enter the home through open windows and doors and ventilation units.

West Virginia — where 20% of adults smoke (more than any other state) — ranks somewhere in the middle of all the U.S. states, with an average 73.2 searches made per month for air purifiers.

04 Air purifier capital states increased

When it comes to increased concern over indoor air quality, New Hampshire leads, having seen a +29.7% jump in the average monthly number of searches for air purifiers in 2023 compared to 2022. As well as the aforementioned wildfires in Canada, three in five households in the state use petroleum products as their primary heating fuel (a rate seven times higher than the national average). Burning fuel oil releases emissions like sulfur dioxide and nitrogen oxide. 

Nevada comes second (+26.4%), where (like New England) wildfires in neighboring areas — combined with ozone — are contributors to poor air quality.

Understanding the causes of poor indoor air quality

We’ve gone over some of the contributors to poor indoor air quality, but take a look at our infographic below to find out how different types of pollutants can affect different rooms in your home. 

05 Air purifier capital infographic

Easy ways you can improve indoor air quality

If you’re concerned about indoor air quality, here are our five top tips to help improve the health of the air in your own home. 

1. Let fresh air in

The American Lung Association advises opening your windows for ten minutes every day to let fresh air circulate in your home (unless you live near a busy highway or pollution-emitting factory). 

Tip

Make sure to check what the local air quality is like each day; if the air is particularly polluted (perhaps from a local wildfire), it’s best to keep your windows shut. 

2. Install a carbon monoxide alarm

Carbon monoxide is a deadly, odorless gas that is produced when fuel is burned. It can leak out of appliances like stoves, fireplaces and furnaces. Make sure you have a working carbon monoxide alarm in your home to ensure your indoor air is safe to breathe. 

3. Stop smoking

According to the Environmental Protection Agency: “There is no known safe level of exposure to secondhand tobacco smoke.” If someone in your household smokes, encourage them to give up the habit completely, cut down or smoke outside if they have to. 

Tip

For those who share a home with a smoker, I suggest reading our advice on how to minimize secondhand smoke

4. Get a dehumidifier

Too much moisture in the home (e.g., from condensation in the bathroom) can cause mold to form, which can worsen asthma and cause respiratory issues. A dehumidifier works by extracting moisture from the air, lowering the chance of mold forming.

5. Stay on top of cleaning

Make sure you remove mold thoroughly if you find it in your home. You can make cleaning solutions using low-cost ingredients. Pet dander and dust in the air can trigger allergies, too, so try to vacuum your home at least once or twice a week (more regularly if you have pets) and keep surfaces free of dust with a microfiber cloth.

Tip

You may also want to consider investing in an air quality sensor to monitor the health of the air in your home and an air purifier, which works by removing pollutants from the air and filtering them safely out. 

Methodology

To generate these tables, we started by translating the phrase “air purifier” into 136 different languages. 

Then, using the Ahrefs Keyword Explorer, we logged the average monthly Google search volume in 2023 for every country. We repeated this process with the DataForSEO tool to retrieve 2023 data for every U.S. State.

(Note that country search volumes were adjusted based on each country’s Google market share, sourced from gs.statcounter.com/search-engine-host-market-share/)

We then calculated the search volume per 100,000 people in every country and state to assess the relative concern for each region.

To monitor the change in indoor air quality concerns by country, we calculated the % change in monthly search volume from 2018 to 2013.

To monitor the change in indoor air quality concerns by state, we calculated the % change in monthly search volume from 2022 to 2023.

The data is correct as of January 2024.

SOURCES

The U.S. wildfire index: How and where wildfires spread across America

Header The US Wildfire Index How and Where Wildfires Spread Across America

Wildfires in the U.S. are becoming more destructive, and it isn’t only the land that suffers — it’s the air.

Fine particulates in the air rose by 55% and black carbon by 86% in the western U.S. between 2010 and 2020, adding 670 premature deaths per year to the toll, according to one study. These pollutants can cause strokes, heart attacks and asthma attacks, and wildfire smoke can cause recurring respiratory illnesses in children.

Conditions will worsen as climate change intensifies. “Climate change, including increased heat, extended drought, and a thirsty atmosphere, has been a key driver in increasing the risk and extent of wildfires in the western United States during the last two decades,” says the National Oceanic and Atmospheric Administration, noting that the drying of organic matter “doubled the number of large fires between 1984 and 2015.”

Global warming exceeded 1.5C for a full year for the first time in the 12 months to February 2024. But how has the land responded? We analyzed wildfire data for 2023 to find the most common causes of wildfires, the states and counties where they are most common and where they’ve increased the most.

How we collected this data

The HouseFresh data team analyzed National Interagency Fire Center data to determine the size, number and causes of wildfires across the United States. Looking at figures for 2023, we then ranked the causes of wildfires by number of occurrences. In addition to this, we also ranked states and counties based on total acres of land burned, year-on-year increase in land burned and the average number of acres burned per wildfire.

Key findings

  • The biggest human cause of wildfires in the U.S. is debris and open burning, which caused 38.67% of fires in 2023.
  • Humans directly caused 72.6% of wildfires in 2023, the second-highest proportion in a decade.
  • California is the state with the most burned land in 2023 (344,878 acres).
  • Arizona is the state with the largest increase in annual land damage in 2023 (+70,733 acres).

The most common human causes of wildfires in America

Climate change exacerbates the conditions for wildfires. But it is usually a particular human or humans that provide the spark. Humans caused nearly three-quarters (72.6%) of wildfires in 2023. We found that the most common human cause of wildfires is debris and open burning, which is the case in 38.67% of human-caused fires — up from 33.53% in 2022.

01 The Most Common Ways People Spark Wildfires in America

‘Debris and open burning’ refers to yard fires, pest control and open trash burning, among other open fires. This category does not include campfires, which come under ‘recreation and ceremony.’ To prevent open fires from spreading, the National Interagency Fire Center (NIFC) says they “must be in small 4 feet by 4 feet piles” and that you should clear “all flammable material and vegetation within 10 feet of the outer edge of pile.” Weather and wind conditions, and local permit requirements, should also be accounted for.

Not only are human wildfires preventable, but they were the main threat to 97% of wildfire-threatened homes between 1992-2015, according to one study. Another found that human-caused fires spread twice as quickly and, since they burn more intensely, kill two to three times more trees in the affected area. So, we looked at how the balance between natural and human-caused wildfires has shifted over the past decade.

02 What percentage of Wildfires Are Caused by Humans In America

We found that the balance between human and natural fires has almost reversed since 2014, although the trend has not been smooth. The proportion of human-caused wildfires grew significantly in 2015, 2016 and 2020, peaking at 77.2% in 2020. This may have been connected to the lockdown period, with more people meeting outdoors or burning trash and renovation waste; the small reduction in human-caused fires since then may be attributed, in part, to education campaigns that arose in the wake of those incidents.

Visualizing the scale of wildfires by state

California suffered the greatest acreage of wildfire destruction in 2023. The amount of damage rose by 29,487 acres to 344,878 acres year-on-year, the fifth largest increase of any state in this period. We found ten states where upwards of 100,000 acres burned in 2023, mostly to the west but also including Texas (168,764 acres) and Oklahoma (152,902 acres).

03 Visualizing the Scale of Wildfires by State in 2023

Drought has been a consistent condition in California across much of the century so far; however, the extreme wet conditions of 2023 and forecasted, in 2024 are not unconditionally good news. Rain is good for wildfire resistance in the short term but encourages the growth of grasses and brush that will become more dangerous when drought returns.

Next, we looked at the overall change in land burned between 2022-23 from state to state. Arizona’s wildfire footprint grew by 70,733 to 218,286 acres, the biggest leap, making it the third hardest-hit state in 2023.

04 The States With the Biggest Change in Acres Burned by Wildfire

Alaska suffered the second most land damage in 2023, despite the largest annual reduction by acre — down 2,818,744 acres from 3,113,849 in the previous, record-breaking year. “Since the 1970s, summer temperatures in Alaska have risen over four degrees Fahrenheit in regions where wildfire is prevalent,” explains Science Communication Specialist Zav Grabinski. “As the air temperature rises, the air holds more moisture, leading to more convective storms.”

Unfortunately, many places where fires burn are hard to reach; at the same time, permafrost and surface fuels make Alaska’s wildfires particularly pollutive.

Visualizing the scale of wildfires by county

Finally, we looked at which U.S. counties were worst hit and saw the largest increases in 2023. Southeast Fairbanks, Alaska, suffered the largest wildfire footprint in 2023: 141,399 acres, up 115% from 2022. Neighboring Denali was the fifth-worst hit in the U.S. (97,007 acres). In one 24-hour period, the state recorded an incredible 18,600 lightning strikes.

05 The 20 Counties With the Most Acres Burned by Wildfires in 2023

Catron in New Mexico was the second worst-hit county in 2023 despite a 61% reduction in affected acreage from 2022. Most of the county’s 2022 footprint burned in just one wildfire incident: the 325,000-acre Black Fire. The fire was so extreme that despite containing it in July, the Forest Service decided to wait for the next snow — predicted to be November at the earliest — before declaring the fire extinguished.

The biggest increase of any county was for Del Norte, California, whose wildfire footprint rose 11,165 times over from 10 acres in 2022 to 110,534 in 2023. Governor Gavin Newsom declared a state of emergency in August after lightning strikes sparked over two dozen fires and knocked out the entire county’s power.

06 The 20 Counties With the Biggest Increase in Acres Burned by Wildfire

“We do have a rich fire history, but the intensity we saw this year and the rate of growth was not something we usually deal with,” said Rachel McCain, natural resources director for the Tolowa Dee-ni’ Nation in Del Norte County. “This is definitely the biggest fire we’ve dealt with in about 30 years.” The smoke and poor air from Del Norte’s Smith River Complex fires reached as far as San Francisco.

How bad is wildfire smoke for your health?

Flames and destruction may grab the headlines, but wildfire smoke has devastating effects. Not only does it further compound the very issue — climate change — that contributed to the fire in the first place, but it spreads far from its source and into homes and schools, apparently safe from the primary effects of the fire.

Here are five ways that wildfire smoke can affect your and your loved ones’ health.

Respiratory illnessInhaling fine particles irritates your lungs and airways. This can cause coughing or difficulty breathing, and worsen issues such as asthma or chronic obstructive pulmonary disease (COPD).
Cardiovascular issuesParticles can get into your bloodstream, triggering inflammation that can lead to heart failure, heart attack or stroke.
Developmental damageBreathing poor air, including wildfire smoke, can slow a baby’s development and increase the risk of asthma. One study suggests that wildfire exposure can cause cell damage to first- and second-trimester placentas.
Higher risk of infectionInhaled particles from wildfire smoke may impact your body’s ability to expel “inhaled foreign materials,” including viruses and bacteria.
Impaired cognitionLike traffic pollution, wildfire smoke has been linked with poorer learning outcomes for children, possibly due to changed breathing rates.

How to protect your home from wildfire smoke

Now that wildfire smoke is an inevitable part of life across much of the country, it pays to prepare your home, maintain supplies and know what to do before the smoke from wildfires spreads close to your neighborhood.

Danny Ashton HouseFresh

“Your home should be a sanctuary, and it is possible to significantly reduce the impact of wildfire smoke on those inside it. The strategy you can take to protect your home can be summed up in these three steps:

Seal it up. On bad air days, close all windows and doors and the intake dampers or vents on your air conditioning units.

Circulate good air. Keep the air fresh and cool by keeping it moving indoors. Set your AC to ‘recirculate’ so as not to suck in bad air from outdoors. Evacuate, if possible, if you can’t keep your home cool.

Create a “clean room.” Maintain one sealable room free from contaminants such as cigarette smoke and cooking smells. Install an air purifier with a high-efficiency filter, and use this room to sit out the worst episodes.

Make a DIY air purifier. You can build your own Corsi-Rosenthal Box with a box fan, four HVAC filters (ideally MERV 13), scissors and duct tape.

Stock up on N95 respirator masks. N95 respirator masks will offer you an extra layer of protection, particularly when you need to go outdoors. 

You can read our full guide to protecting your home from wildfire smoke and what to do when a bad air day arises for more details.”

— Danny Ashton, HouseFresh Founder & Senior Writer

At any moment, you can check the Fire, Weather & Avalanche Center to see where wildfires are burning right now. But preparation is more powerful than response. 

METHODOLOGY

To determine the size, number and causes of wildfires across the United States, we reviewed data from the National Interagency Fire Center. The causes of wildfires were ranked based on the number of wildfire incidents in 2023. States and counties were ranked based on total acres of land burned due to wildfire in 2023, the increase in acres of land burned due to wildfire from 2022 to 2023 and the average number of acres burned per wildfire in 2023. Data was collected in January 2024.

The New York City ZIP codes with the most air quality and mold complaints

Header The New York Zip Codes With the Most Air Quality and Mold Complaints

New York’s 311 helpline sees it all. In 311’s 20-year history, New Yorkers have called the number over 500 million times to get help and information from non-emergency City services. The 311 call records database has become a virtual portrait of New York City — from the point of view of what its inhabitants feel the need to complain about.

As often as not, the bizarre 311 calls make the headlines. These quirky inquiries capture the unique character of the Big Apple and its inhabitants. But 311’s true purpose is to improve home and street life for locals. And so it becomes the battleground for more serious issues, from a police parking abuse case that remains unresolved after 232 calls or a decline in reports of rat sightings that may be down to New Yorkers “just getting used to them.”

In a tight and industrious city like New York, health issues like mold and air quality have the potential to impact every area of life. But all of New York City is not the same, and the 311 calls database reveals a very uneven spread of air quality and mold complaints from borough to borough. To see which ZIP codes are the worst hit, we at HouseFresh analyzed call volume from the 311 database to rank and map the neighborhoods with the most complaints in New York.

What we did

We analyzed data from the NYC Open Data website about 311 calls in the 12 months from November 2022 to October 2023. We used this data to identify the New York boroughs and ZIP codes with the most complaints (per 10,000 people) about mold, indoor air quality and outdoor air quality. We then compared these to the equivalent figures from November 2017 to October 2018 to see how the level of complaints has changed in the past five years.

Key findings

  • The Bronx has the most mold complaints, with 73.31 calls per 10,000 inhabitants per year.
  • Manhattanites make 12.12 indoor air quality complaints per 10,000 people per year, the most of any borough.
  • Manhattanites also make the most outdoor air quality complaints: 13.47 per 10,000 people per year.
  • However, indoor air quality complaints in Queens have risen by 82.28% over five years, the biggest change in our study.

The places in New York City with the most and least mold complaints

Molds are a type of fungus, and they thrive on moisture. They reproduce by spreading spores in the air and can damage the surfaces on which they grow.

Although molds are an important part of the natural environment, when they spread indoors, they can lead to allergic reactions such as sneezing, rashes and dizziness. Molds can also lead to more severe reactions, such as asthma, and are particularly harmful to children, the elderly and those with respiratory problems.

Worried about mold in your home? There are easy ways to test for it.

First, we mapped the New York boroughs with the most mold complaints per 10,000 inhabitants. The Bronx is way ahead with 73.31 complaints, practically twice that of second-placed Manhattan. This is despite complaints in Manhattan rising by 32.59% over the past five years.

01 The New York City Boroughs With the Most Mold Complaints

The Bronx is home to a dense level of public housing, an area where mold management can be slow and inconclusive. Some 8% of children living in the Bronx are living with chronic lung disease, and in the South Bronx, asthma rates are eight times the national average. The Bronx has long been New York City’s leading borough for mold, and mold reports have risen by 17.12% over the past five years.

Next, we zeroed in on the precise neighborhood ZIP codes where mold reports are most and least common. Sure enough, the two outliers are in Manhattan — specifically, in the 10030 ZIP code of Harlem — and 10474 in the Bronx, at Hunts Point.

02 The New York City ZIP Codes With the Most and Least Mold Complaints

Hunts Point has become known for a number of buildings kept in a poor state of repair, although much of this is the responsibility of landlords rather than the city. “It is draining to have to fight for something that’s really just the right that should be given to you,” says Grace Medico Cuapio, a Hunts Point organizer for Banana Kelly, a community improvement association.

The neighborhood with the tenth most complaints about mold is NYC 10040, covering parts of Washington Heights and Inwood in Manhattan. Some 99.25 complaints per 10,000 people were made here last year, an increase of 200% from 2017 to 18 figures. This makes it the ZIP code where complaints have risen most dramatically over the past five years.

03 The New York City ZIP Codes Where Mold Complaints Have Changed the Most

Washington Heights resident Jose Jimenez has had mold growing in his apartment for 20 years, with a succession of landlords either ignoring the damage or painting over it temporarily. “It is no secret there are landlords who neglect units occupied by long-term tenants, as part of a broader strategy to increase turnover and displacement,” claims Jason Wu, the attorney representing Jimenez in court. Painting over mold covers the problem, but if moisture remains, the mold will reappear and continue to grow.

The places in New York City with the most and least indoor air quality complaints

Indoor air quality is affected by a number of issues that New York residents can complain about, including:

  • Dust from building work.
  • Chemical odors, including soot and vapors, when originating in the building.
  • Dry cleaning odors from a neighboring home or business.
  • Sewage, feces and poor ventilation.
  • Smoke, dust and airborne debris from a neighborhood fire.

Manhattan is the leading district for indoor air quality complaints, with 44.6% more complaints per 10,000 inhabitants than second-placed Brooklyn. And this is despite complaints from Queens, the Bronx and Brooklyn rising significantly more than Manhattan over the past five years. There were 12.12 complaints per 10,000 people in Manhattan last year.

04 The New York Boroughs With the Most Indoor Air Quality Complaints

Governor Kathy Hochul announced a $3.5 million boost in state funding for environmental justice initiatives in November 2023, with substantial investment in air quality monitoring and improvement. “Both the community impact and air monitoring grants support the crucial work of not-for-profit, community-based organizations that develop a wide variety of projects that drive positive change and improved environmental outcomes in their communities,” said Environmental Conservation Commissioner Basil Seggos.

The 10282 ZIP code, representing the area between Battery Park and Rockefeller Park, just north of the 9/11 memorial in Manhattan, is New York’s worst area for indoor air quality complaints. Here, complaints are made at just over double the citywide average rate. While developers in this area pioneered green building in New York, Battery Park remains known for its high-density population. The contrast between the area’s famed green spaces and busy living spaces may draw attention to poor air quality when it occurs.

05 The New York City ZIP Codes With the Most and Least Indoor Air Quality Complaints

Meanwhile, residents in the New Hyde Park area at ZIP code 11040 made just 0.23 per 10,000 people last year. In a previous study, HouseFresh discovered that New Hyde Park also receives the fewest sanitation-related 311 complaints, suggesting that the area is kept very clean — or that the locals don’t like to complain.

Two ZIP code areas have seen an increase of well over 1,000% in complaints made about indoor air quality. Complaints in Woodhaven (ZIP 11421) rose by 4100%, while in Middle Village (11379) they rose by 1480%. Ironically, Woodhaven nestles up alongside the Ozone Park neighborhood — the area was named before the ozone gas was properly understood, back when it was associated with fresh, healthy air. In fact, ozone — the gas, not the place — smells somewhat bleach-like.

06 The New York City ZIP Codes Where Indoor Air Quality Complaints Have Changed the Most

Additionally, the Glendale Superfund site, just north of the Woodhaven neighborhood, “has been known to send a plume of toxic tetrachloroethylene” skywards due to industrial activity when a knitting mill occupied the site nearly sixty years ago. Although the Department of Health has insisted there is no continued danger, the issue continues to rear its head due to an ongoing remediation process with locals.

The places in New York City with the most and least outdoor air quality complaints

Outdoor air quality can affect the whole city at once. The Department of Environmental Conservation uses the Air Quality Index (AQI) to measure safety levels. 

Citywide Air Quality Action Days are when the AQI is between 101-150. This can be due to:

  • Neighborhood fires.
  • Incoming wildfire smoke.
  • Chemical odors.
  • Vehicle emissions.

As with indoor air quality, Manhattan is the leading borough for outdoor air quality complaints — in this case, with 52.42% more than Brooklyn. While the Bronx is the third worst area for indoor air complaints, Bronx residents make the fewest complaints (per 10,000 people) about outdoor quality out of any of the five boroughs.

07 The New York City Boroughs With the Most Outdoor Air Quality Complaints

Amidst the June 2023 wildfires, New York City reached an AQI of 342, making it temporarily the worst city in the world for air quality. “This may be the first time we’ve experienced something like this of this magnitude,” said Mayor Eric Adams. “Climate change is accelerating these conditions. We must continue to draw down emissions and improve air quality and build resiliency.”

Multiple lower Manhattan ZIP codes are among those making the most complaints of all. The Tribeca Festival organizers provided masks to its staffers and considered postponing events in June 2023 as worsening conditions impacted incoming flights.

08 The New York City ZIP Codes With the Most and Least Outdoor Air Quality Complaints

SoHo occupies much of the 10012 ZIP code, where the fourth-highest number of complaints were made. Workers at the SoHo branch of outdoor retail chain REI “successfully pressured management to close,” but only after the AQI levels reached over 400, according to a union Instagram post. “Before that, they held our reduced wages over our heads, forcing workers to choose between our own safety and our livelihoods,” claimed the workers.

A Bronx ZIP code, 10462, has shown the most significant growth in complaints over the past five years. This ZIP covers Parkchester, Westchester Square and Castle Hill. Across the Bronx, the Co-op City area has seen the largest reduction in complaints.

09 The New York City ZIP Codes Where Outdoor Air Quality Complaints Have Changed the Most

Some four out of five Parkchester homes have air conditioners installed, according to the New York City Department of Health and Mental Hygiene. The air in Parkchester was found to contain 7.6 micrograms of fine particulate matter (PM2.5) per cubic meter — a little over the city average and a little under the Bronx average.

How to protect yourself from mold and common air quality issues at home

Mold and poor air quality can significantly damage your health, and researchers have shown air pollution to have a negative impact on the academic performance of children. Many issues that arise require civic or corporate intervention on a grand scale. But there are achievable steps you can take around the home to protect your family from the effects of these public health issues.

1. Control indoor humidity. Keep humidity levels well below a dew point of 50° by installing a dehumidifier of an appropriate size and capacity for the room where mold is an issue. Take short, cool showers when possible.

2. Ventilate. Use exhaust fans in the bathroom and kitchen when possible. Ensure that the HVAC system is turned on (or windows opened) following cleaning activities such as mopping or during humid weather conditions.

3. Clean moldy areas. Routinely clean areas where mold builds up, such as shower curtains, bath mats and the areas around them. However, bear in mind that a professional contractor may be a better choice for cleaning up significantly moldy areas.

1. Limit exertions and excursions. Try not to go outside on Air Quality Action Days, and avoid strenuous activities to minimize bad air intake.

2. Wear a mask. City officials and health experts suggest wearing an N95 or KN95 face mask to filter out dangerous particles.

3. Avoid polluting activities. NYC 311 recommends that you don’t mow your lawn, use aerosol products, use a fireplace or drive a car on bad air days.

1. Use natural cleaning products. Keeping a clean home helps maintain clean air levels, but using products that contain certain chemicals and gasses can worsen things. Try to choose EPA Safer Choice products where possible.

2. Maintain your HVAC system. Hire a pro or learn how to clean air vents, and be sure to check them at least once a year.

3. Choose the right air purifier. Purifiers with HEPA (high-efficiency particulate arresting) filters are more effective at trapping dangerous particles.

METHODOLOGY & SOURCES

To identify the New York neighborhoods and ZIP codes with the highest number of 311 complaints per 10k population for mold, indoor air quality and outdoor air quality, we analyzed 311 data for the most recent 12 months from the NYC Open Data website (November 2022 to October 2023).

For each complaint type, we recorded complaint counts for each borough and ZIP code between November 2022 and October 2023. We then repeated this process for the corresponding time period five years prior (November 2017 to October 2018).

This allowed us to calculate the boroughs and ZIP codes with the most and fewest complaints per 10k population for each metric and the five-year change in complaints per 10k.

The U.S. real estate markets most vulnerable to climate change

Header The US Real Estate Markets Most Vulnerable to Climate Change

The immediate effects of climate change, already being felt around the world, include extreme weather events, unpredictable crop yields and increased health risks from harmful air and insect-borne diseases. And the knock-on effects can be just as impactful.

One key area for homeowners and investors is the falling value of properties at high risk of damage from weather events and other conditions brought on by global warming. One recent study found that U.S. homes exposed to flood risk are overvalued by $121–$237 billion and that lower-income households suffer “greater risk of losing home equity from price deflation.”

More positively, a 2022 report from McKinsey suggests that climate change “not only creates new responsibilities for real-estate players to both revalue and future-proof their portfolios but also brings opportunities to create fresh sources of value.” Such opportunities might include redeveloping and “climate-proofing” at-risk properties and areas.

Whatever your perspective, if you are a homeowner or have interests in real estate, it is essential to understand the turbulence ahead. That is why the HouseFresh team has identified the cities and states with the highest proportion of home listings at high risk from climate change-related fire, flood, wind or heat in the next thirty years. To do this, we analyzed risk data for each property market using Risk Factor™ and Redfin, ranking cities and states based on the percentage of property listings that carry a major risk.

You can find our full methodology at the foot of the article.

  • In Wyoming, 90% of listed properties have a major fire risk — more than in any other state.
  • St. Petersburg, Fla. (42.7%), and Honolulu (34.4%) are the cities with the most properties at extreme risk of flood.
  • We found eight states and 14 cities where 100% of properties have an extreme wind risk.
  • Miami and New Orleans are among 11 cities where 100% of properties have an extreme heat risk.

The states and cities with the highest percentage of home listings with a major fire risk

Wildfires are not just a result of increasing heat but climate-related factors, such as increased droughts and tree-killing beetles, that make woodland more susceptible to fire.

Before we jump into the findings of our study, we have created a mini-infographic to explain the wildfire risk factor:

01 Understanding the Fire Risk Factor

Every year, news of wildfires and associated losses hits our screens and re-ignites debates over climate change. Yet from 1990-2010, the areas where wildfires were most pronounced experienced 41% growth in the number of houses built (33% growth by area).

This made wildfire-prone land “the fastest-growing land use type in the conterminous United States” during that period, according to the study that produced those figures. According to Timothy Collins, a geography professor at the University of Utah, “people are drawn to those environments because of the amenities associated with forest resources.”

02 The States With The Highest percentage of Home Listings With a Major Fire Risk

We found that Wyoming is the state with the highest proportion of listings with a major fire risk, by a significant leap. Not only are many houses built with high-risk materials in high-risk areas, but Wyoming has a “significantly disproportionate land-to-resource ratio,” meaning a low proportion of firefighters and other resources compared to the extent of the fires it suffers.

“In my experience, Wyoming has had wildfires that started to burn in one county on private lands and over the next several days, spread across three different counties, burning private, state, and BLM [Bureau of Land Management] lands,” Kelly Norris, Interim Wyoming State Forester, told a recent senate committee hearing, noting that Wyoming’s forests provide $26 billion of value per year.

Unsurprisingly, Wyoming is also home to the city whose property is most vulnerable to wildfire. As the chart above shows, 62% of listed properties in Cheyenne are high-risk. However, Riverside, Calif., is not far behind, at 59.2%.

03 The Cities With The Highest percentage of Home Listings With an Extreme Fire Risk

Colorado Springs joins the leading pack with 46.4%, but other big cities have a significantly lower proportion of high-risk properties. This overall lower risk to city properties compared to the state-wide figures is partly due to the lower proportion of flammable vegetation in built-up areas.

The states and cities with the highest percentage of home listings with a major flood risk

Global warming leads to increased water evaporation, which intensifies rainfall. According to the Environmental Defense Fund (EDF), a rise of one degree Fahrenheit can lead to 4% more vapor in the air — meaning there may be as much as 9% more moisture in the air now than in 2023. And the effects of intensified rainfall are exacerbated by the urban environment, which has “eliminated many natural landscape features that would otherwise slow rainwater’s path across the land and absorb it deeply underground.” Meanwhile, rising sea levels pose an ever-greater threat to coastal areas.

Here’s how flood risk is measured:

04 Understanding the Flood Risk Factor

Hawaiian properties are most at risk of flooding. As an archipelago, the state is at risk of rising sea levels, coastal erosion and storms, hurricanes and tsunamis. At Hilo Bay, the sea level has risen by 10 inches since 1950 and now rises by one inch every four years.

05 The States With The Highest percentage of Home Listings With a Major Flood Risk

Louisiana (55.30%) and Florida (32.73%) complete the top three states for flood risk. According to McKinsey, “the value of homes in Florida exposed to changing climate-related risks are depressed by roughly $5 billion relative to unexposed homes.” In Florida, as elsewhere, this risk disproportionately affects minority communities.

We also found that the cities with the most homes at risk of flooding are in these states. St. Petersburg (42.7%) is on Florida’s Gulf Coast, while the Hawaiian capital, Honolulu, is second-most at risk (34.4%), as our following chart shows.

06 The Cities With The Highest percentage of Home Listings With an Extreme Flood Risk

Twelve of the cities with the highest proportion of property listings at high risk of flooding are coastal. The real estate market is particularly sensitive to the threat of coastal flooding following Hurricane Sandy, which killed 182 people and caused more than $70 billion in damage — making it America’s second costliest storm after Katrina. In New York City, the price of flood zone properties not damaged by Hurricane Sandy fell by 8% in the wake of the disaster.

The states and cities with the highest percentage of home listings with a major wind risk

“[M]ajor hurricanes have caused more damage to local populations and ecosystems than any other natural disaster,” according to researchers. And they are on the increase, energized by warmer sea surface temperatures and intensified by higher sea levels.

The visual guide below explains how Wind Risk is measured:

07 Understanding the Wind Risk Factor

Hurricane winds cover large distances at high speeds and are often connected to intense rainfall — hence the flooding described above. But the wind itself affects buildings in multiple ways, from cutting power lines to lifting roofs, tilting structures and even overturning whole homes.

We found eight states where 100% of listed property is considered at high risk of wind damage. The list is dominated by Atlantic Coast states, from Florida all the way up to Massachusetts.

08 The States With The Highest percentage of Home Listings With a Major Wind Risk

Climate change is “poised to bring hurricanes that intensify quicker and, with them, a heightened risk of flooding to the U.S. Atlantic Coast,” reports the Department of Energy’s Pacific Northwest National Laboratory. Researchers at the lab discovered a “unique coastal phenomenon lies at the heart of the bustling hurricane activity” and that “the same mix of hurricane-favoring conditions doesn’t appear in the Gulf of Mexico.”

We also found that 100% of the listings in the top 14 cities are flagged for high wind risk. But in this case, the balance is more in the direction of the Gulf Coast. These cities include Corpus Christi, Texas, which was the point of entry for Storm Harold in August. That storm achieved wind speeds of 45-50 mph in the area; winds are given tropical storm status when they hit 39 mph.

09 The Cities With The Highest percentage of Home Listings With an Extreme Wind Risk

Being a way back from the coast doesn’t guarantee protection either. The Louisiana cities in our chart are dozens of miles from the coast.

In 2020, Louisiana suffered its strongest hurricane in 150 years, with gusts up to 137 mph. “The hurricane severely damaged residential and commercial buildings, knocked mobile homes off their platforms and blew out windows from the city’s tallest building,” reports Climate360.

Many have found themselves displaced for months to hotels, trailers or even tents while awaiting insurance payouts and home repairs.

The states and cities with the highest percentage of home listings with a major heat risk

The risk of extreme heat levels is measured according to an area’s hottest month of the year. Extreme heat levels can unsettle a home from its very foundations, drying out the soil beneath the concrete and causing walls to crack and floors to slope. The materials that homes and the surrounding infrastructure are made from can buckle and warp, and heat can also cause further damage and disruption to home sensors and devices such as solar panels.

The short infographic below covers what you need to know about Heat Risk:


10 Understanding the Heat Risk Factor

Once more, states on or near the Atlantic Ocean or the Gulf of Mexico are most at risk. In the case of heat risk, 100% of the properties in 13 states are flagged, while Alabama and Tennessee are not far behind on 99% each.

On the other hand, there are 13 states where no listed properties are considered at high risk from extreme heat. These are almost all inland, and the majority are in or around the Midwest.

11 The States With The Highest percentage of Home Listings With a Major Heat Risk

Oklahoma stands out among the highest-risk states for being positioned some distance from the Gulf of Mexico. By the mid-2080s, Oklahoma will likely experience three to four times as many days above 100°F as it has now.

Unlike the majority of states, Oklahoma actually cooled over the last century. This was “due to natural cycles and sulfates in the air,” according to the U.S. Environmental Protection Agency, but “[n]ow sulfate emissions are declining, and the factors that once prevented parts of the state from warming are unlikely to persist.”

In contrast, the 15 most at-risk cities are all in the southeast and towards the coast. These include Norfolk, Va., where an $8.1 million building has recently been constructed to deliberately suffer the effects of climate change — and thus “showcase strategies to stay longer in harm’s way.”

12 The Cities With The Highest percentage of Home Listings With an Extreme Heat Risk

In our city rundown, Chandler, Ariz., is the outlier, being positioned in the southwest and in a landlocked state. Heat is already the leading weather-related cause of death in Arizona, and Chandler’s position in the Sonoran Desert, compounded by the urban heat island effect, makes the city particularly vulnerable to dangerous temperatures. Just this summer, the city made the news when a local librarian reported that his shoes had melted while guiding children across a hot street.

Preparing for the Unknown

We know that climate change is coming and that conditions will become more difficult. However, the extent of the change is not yet known and depends greatly on the steps taken by international governments and corporations.

Homeowners, developers and other parties with interests in real estate can already take steps to mitigate the risk, damage and costs to property in the coming months and years. However, the precise risk faced by a property is not a simple issue to estimate: “The challenge with these perils is that you don’t see identical damage to each house,” says Tom Larsen, an insurance and spatial solutions specialist at data analytics firm CoreLogic. “So we use our spatial modeling to look on a granular level at every house. We can look at the elevation above the sea level of the first floor of a house and follow wildfire patterns property by property.”

Be it fire, flood, wind or heat — or, more likely, a combination of the above — forewarned is forearmed.

METHODOLOGY

To determine how climate risk factors affect house values, we reviewed data on flood, fire, wind and heat risk from Risk Factor™ and Redfin. States were ranked based on the percentage of Redfin property listings in each state that carry a major risk of 5 or above on Risk Factor’s 10-strata risk scale, while cities were ranked based on the percentage of property listings that carry an extreme risk of 9 or above on Risk Factor’s 10 strata scale. Only cities with at least 100 properties listed on Redfin were considered.

According to Risk Factor™: 

  • A “major” Fire Factor® score of 5 or higher means a property has a 6%+ chance of being exposed to wildfire in the next 30 years. An “extreme” factor score of 9 or higher means a property has a 26%+ chance of being exposed to wildfire in the next 30 years.
  • A “major” Flood Factor® score of 5 or higher means a property has a major risk of being reached by flood waters in the next 30 years. An “extreme” flood risk factor of 9 or higher means a property has an extreme risk of being reached by flood waters in the next 30 years.
  • A “major” Wind Factor® score of 5 or higher means that the wind speed during extreme wind events at that property will average to 41 mph or greater over the next 30 years. An “extreme” factor score means that the wind speed during extreme wind events at that property will average to 77 mph or greater over the next 30 years.
  • A “major” Heat Factor® score of 5 or higher means that the average heat index during the hottest month of the year will be 89°F or higher over the next 30 years. An “extreme” heat factor score of 9 or higher means that the average heat index during the hottest month of the year will be 104°F or higher over the next 30 years.

The data was collected in December 2023 and January 2024.

The cities with the most and fewest good air days

Header Good Air Days 1

Few things affect a person’s quality of life more than good air. Data from the Institute for Health Metrics and Evaluation shows ambient particulate matter as the sixth leading cause of global excess deaths each year. The World Health Organization (WHO) claims that 93% of the world’s children breathe air with higher levels of pollution, and medical studies have demonstrated the connection to respiratory diseases, including lung cancer.

While rising global temperatures and the climate crisis are existential threats to humanity, air pollution from fossil fuels is an immediate risk to human life, with a study from Harvard University linking fine particulate matter (PM 2.5) to one in five excess deaths globally. These air particles, which occur naturally and through man-made activity, are roughly 2.5 micrometers in diameter — around 30 times smaller than a strand of human hair.

Removing pollution from the atmosphere and exposing the world’s population to clean air is a major priority, with the United Nations listing it as one of their Sustainable Development Goals. The benefits of clean air are plain to see: reduced illnesses and death, improved quality of life and healthier and more sustainable cities.

The U.S. Air Quality Index (AQI) is a widely-accepted barometer for air quality and ranks pollution levels based on the concentration of PM 2.5 particles in the atmosphere. These range from “Good,” with less than 12 µg/m3, to “Hazardous,” with more than 35 μg/m3.

To find out which cities around the world have the cleanest air, HouseFresh analyzed pollution levels in more than 500 global urban areas, ranking them to see which locations have the most and fewest good air days.

How we conducted this study

Particulate matter (PM 2.5) pollution data was sourced from the World Air Quality Index database of air quality measures, with supplementary data from the AirNet API. Pollution values represent PM 2.5 pollution levels in each city, expressed as micrograms per cubic meter of air, or µg/m3, an average of daily observations during a given year.

The number of “Good Air Days,” as defined under the U.S. Air Quality Index (AQI), was taken as the total number of days where the PM 2.5 concentration was below 12 µg/m3.

We have reviewed the data and, according to the World Air Quality Index, all air quality monitoring stations in Calama report good air quality, with three stations reporting that there has been good air quality for the last 12 months. We have double-checked this data against IQAir’s air quality data for Chile, and it also shows Calama as one of the cities with the cleanest air in the country regarding PM2.5 air pollution.

Even though this data is correct from a methodological point of view, it might not be reflective of other types of air quality issues experienced by residents of Calama. In fact, there is currently a decontamination plan being discussed by the local government to tackle PM10 pollution by regulating mining activities and their associated emissions in the area. 


Key findings

  • Nine cities, including six in Australia and New Zealand, have 365 days of good air every year.
  • Zürich, Switzerland, and Reykjavik, Iceland, have the most ‘good air days’ in Europe, with 365 days of low pollution.
  • Los Angeles, Fresno and San Diego — all in California, have the lowest amount of good air days in the U.S., with less than 250 days with low pollution during the year.
  • Honolulu, Hawaii, has America’s lowest pollution for a major city, with 365 days where the PM 2.5 concentration is below 12 µg/m3.

Looking for clean air? Move to Australia

Improving air quality in major cities is an expensive challenge for metropolitan mayors around the world. WHO data shows that 9 in 10 people living in cities breathe polluted air. From transportation schemes to reduce car and bus emissions to renewable energy programs to decarbonize a city’s power grid, the world’s major cities are taking serious steps to reduce air pollution and improve the quality of life for their residents.

But if you’re looking to move to a city with clean air, our research shows that the best place to start is Australia. Six of the ten global urban areas with the most good air days can be found there, all of which benefit from 365 days a year without high levels of PM 2.5 matter in the atmosphere.

01 The 10 Global Cities With the Most and Fewest Good Air Days

Sydney, Australia’s largest urban area, is one of these locations. It is frequently recognized as one of the world’s most livable cities and is home to more than 400 parks and green spaces. However, the city is growing rapidly. Research from the University of Wollongong has created a blueprint for Sydney to lower its air pollution moving forward, from banning diesel vehicles to reducing smoke pollution from wood heaters.

Only one city in the Americas enjoys 365 days of good air per year — Honolulu, Hawaii. Located around 2,000 miles from the U.S. mainland, its residents benefit from some of the cleanest city air in the world. This is likely a result of Hawaii’s strict anti-pollution regulations, and the state is recognized by the American Lung Association for its low PM 2.5 levels.

At the opposite end of the spectrum, four of India’s major cities have one day or less each year of good air. This could be a result of the country’s geography, where pollution in the country’s northern states is trapped by the Himalayan mountains — an occurrence felt especially in the winter months. As an emerging economy reliant on heavy industry and fossil fuel usage, 93% of its population is exposed to unsafe levels of PM 2.5 matter.

Los Angeles has fewer than five months of clean air each year

The White House Office of Science and Technology Policy lists a range of benefits from cleaner air, from the improvement of cognition and productivity to the reduction of environmental triggers for conditions like asthma and allergies. However, a report from the American Lung Association shows that 63 million Americans in 96 counties are subject to the country’s poorest levels of air quality.

Our research shows that six major urban areas in California have the lowest total number of good air days in the country, and its largest city Los Angeles has 71 fewer days with low pollution than anywhere else. With a sprawling urban population of 18 million people, the City of Angels is notorious for its smog and pollution.

03 The 10 US Cities With the Most and Fewest Good Air Days

It has some of the worst traffic corridors in the U.S., and reports from the Environmental Protection Agency suggest that pollution levels have been at their highest in the area since 2010. While other major urban areas in the state, including Fresno (240 good air days), San Diego (246 days) and Sacramento (294 days), are short of good air days, California’s state government has taken action to improve the state’s air quality record.

In November 2022, Governor Gavin Newsom unveiled a plan to reduce air pollution by 71% and greenhouse gas emissions by 85%. At the same time, the state is facing a battle to secure funding for a proposed high-speed rail line to connect Los Angeles and San Francisco — a plan that would cut carbon emissions by 100 million metric tons within 50 years.

America’s largest metropolitan area New York is a stark contrast to its West Coast counterpart. Despite being home to two million more residents than Los Angeles, it sees good air days for 340 days of the year, making it one of the country’s cleanest cities. New York City has cut its PM 2.5 pollution levels by 40% over the last 20 years, transforming itself away from toxic air quality that plagued the health of its residents for decades.

Nordic cities among Europe’s cleanest air locations

Air quality in Europe is subject to tougher regulation than other parts of the world. For the 27 countries in the European Union, a directive restricts the quantity of fine particulate matter in the atmosphere. Brussels took this a step further in November 2022, limiting PM 2.5 matter to 10 µg/m3 in response to data from the European Environment Agency, which links 307,000 excess deaths in the continent to air pollution.

Our research shows that two major European cities (both outside of the EU) have 365 days a year of good air — Zurich, Switzerland, and Reykjavik, Iceland. Located 600 miles off the coast of continental Europe, Iceland’s small population (approx. 300,000) and clean energy production contribute to its low particulate matter levels. Reykjavik is one of six Nordic cities with the most good air days, according to our research. Sweden, Finland, Denmark, Norway and Iceland cooperate directly on air quality through the Nordic Council.

02 The 10 European Cities With the Most and Fewest Good Air Days

However, three major cities in southeastern Europe have less than 100 good air days each year. The capitals of Pristina (27 days), Nicosia (75 days) and Sarajevo (97 days) are among Europe’s most polluted, according to our research. Kosovo’s energy sector is predominantly reliant on coal, with two major plants polluting Pristina’s air to such an extent that residents have protested against the state’s policy.

Lowering air pollution in the world’s major cities

Air pollution in major cities is a huge stumbling block for the world’s climate scientists. United Nations data predicts that 68% of the global population will live in urban areas by 2050. Yet air quality data shows that residents in many of the world’s largest cities struggle to enjoy good air days, potentially causing long-term damage to their respiratory health and well-being.

You can explore our full dataset of 500+ urban areas below, allowing you to see which cities have the most and fewest good air days where you live.

As our cities continue to grow and population centers become more concentrated, how can societies ensure sustainable living conditions for decades to come? Getting it right is central to the commitment made by national governments to the UN’s Sustainable Development Goals. A 2021 report on this issue found that most cities are shifting their focus toward the decarbonization of heavy industry and low-carbon transportation (e.g., vehicle emissions standards).

However, the clock is ticking on air quality as the urgency of the climate crisis mounts. With WHO data indicating that 80% of city dwellers are still exposed to excessive fine particulate matter levels, major metropolitan areas must continue to prioritize the health of their residents by directly targeting air pollution.

The method behind the study

To find the global and American Cities with the most and fewest good air days, we sourced particulate matter (PM 2.5) pollution from the World Air Quality Index database of air quality measures, with supplementary data from the AirNet API. Only cities that have data from at least two (2) monitoring stations for at least 300 days of the year 2022 were included in the dataset. 

Pollution values represent PM 2.5 pollution levels in each city, expressed as micrograms per cubic meter of air, or µg/m3, an average of daily observations during a given year.

To arrive at these numbers, AQI PM2.5 was converted into µg/m3 values using a formula developed by AirNow, a partnership of the U.S. Environmental Protection Agency, National Oceanic and Atmospheric Administration (NOAA), National Park Service, NASA, Centers for Disease Control and tribal, state and local air quality agencies.

The number of “Good Air Days” was taken as the total number of days where the PM 2.5 concentration was below 12 µg/m3. This is defined under the U.S. Air Quality Index (AQI).

Cities in Ukraine were excluded from the comparison due to the ongoing military conflict having an inevitable impact on the level of air pollution.

New York City pollution levels were calculated by aggregating the data from Manhattan, The Bronx, Staten Island, Brooklyn and Queens by taking the median pm2.5 values on each day.

At HouseFresh, we have been reviewing air quality products since 2010, and this includes air quality monitors like the Purpleair Indoor Sensor II, which also provides shared air quality data with the world that helps support big data campaigns like this. If you have any questions about our testing process for different air-quality products, just email us at hello@housefresh.com.

The dirtiest cities in America

A bag of trash

From the career opportunities on offer to the diverse social and cultural experiences that come along with being amongst the hustle and bustle, life in the city is rich with opportunity.

However, with the enduring charm of the bright lights luring in settlers and tourists alike, cities are notoriously densely populated. And with that comes a whole host of issues, including pollution, pests, healthcare problems and poor sanitation.

Since the start of the COVID-19 pandemic in 2020, people around the world have been considerably more concerned about contamination and health risks than ever before. From regularly using hand sanitizer to wearing masks on public transport, being more aware of the cleanliness of our surroundings is now second nature.

Cities, more so than rural areas, often have higher levels of grubbiness. But which cities in the U.S. are the dirtiest? The indoor health quality experts here at HouseFresh have taken a deep dive into the US’s non-emergency 311 complaint system to find out.

We analyzed 12.3 million sanitation-related 311 complaints placed over the last 365 days to reveal the dirtiest cities in America. Covering categories related to sanitation issues — such as garbage, waste and recycling — we ranked locations based on the number of sanitation-related reports per 100,000 population.

Key findings

  • Baltimore is the dirtiest city in America, with 47,295 sanitary-related complaints
  • Milwaukee is the cleanest city in America, with only 309 complaints linked to cleanliness conditions
  • With 89,391 complaints surrounding sanitary issues, 21213 is the dirtiest zip code in Baltimore
  • Zip code 77546 is the cleanest zip code in Houston, and in America, with a mere 19 sanitary-related complaints

Baltimore is the dirtiest city in America

Due to its vast landscape, cities across America come in all shapes and sizes. While each has its own character and reputation, most cities tend to deal with the same kind of issues. And sanitation is one of them.

For example, did you know that more than 1.57 million Americans live without a toilet or tap at home? The lack of basic water sanitation costs the U.S. economy $8.58 billion every year, according to a report produced by DigDee.

From clean drinking water to sewage disposal, littered streets to missed garbage pick-ups, we analyzed 12.3 million sanitation-related 311 complaints in a series of U.S. cities to reveal which metropolises need to clean up their act.

According to our research, it’s the East coast city of Baltimore that needs to concentrate on its cleanliness the most.

01 Dirtiest Cities in America Ranking

Though in close company with the cities of Sacramento, Charlotte and Los Angeles, it’s the residents of Baltimore that are the most discontent with their level of dirtiness. With a staggeringly high complaint rate of 47,295 per 100k population, there seems to be a disconnect between the needs of the community and the cleanliness of the city.

However, if you’re a clean-conscious citizen with little patience for poorly kept neighborhoods, then you might feel more at home in the Midwest. With the smallest number of complaints per 100k population, the affordable city of Milwaukee is the cleanest in the U.S., with only 309 reports. The liberal city of Riverside is not far behind, with a mere 1,609 complaints.

Houston is home to the cleanest city zip code  

Though you may be under the impression that zip codes are only used to locate your home or sort out your mail, they actually have more to do with your welfare and the cleanliness level of your city than you might think. According to USA Today, 60% of your health is determined by your zip code alone. But which city zip codes are the cleanest in America?

According to The 2022 “State of the Air” report produced by the American Lung Association, Houston’s rankings were mixed for some of the most harmful and widespread types of air pollution: particle pollution and ozone. Despite this, the southern city is home to the cleanest zip code with the fewest sanitary-related complaints.

02 Dirtiest Cities in America ZIP Codes Ranking

According to our findings,with a commendable 19 complaints made per 100k population, 77546 is the cleanest zip code in the country. This adds to the city’s number of accolades, including its affordable cost of living and thriving job market. Meanwhile in Baltimore, which topped as the dirtiest city, is home to six of the dirtiest zip codes, each located either in or around the city’s center.

Brooklyn is home to the dirtiest zip code in new york

Despite American novelist John Steinback insisting that New York is ‘a dirty city,’ the Big Apple — with its reputation for being riddled with rats, trash and traffic — isn’t as ‘dirty’ as you may have been led to believe. The city has a surprisingly low complaint rate of 3,728 per 100k population — in comparison to the 21,616 complaints made by the inhabitants of the glamorous — albeit dry, dusty and dirty — Los Angeles. We found that the highest-complaining zip code, with 7,664 reports, came from Brooklyn.

03 Dirtiest Zip Codes in New York

With its population having risen by 6.8% since 2020, according to Best Places, Brooklyn is home to more than 2.5 million U.S. citizens and attracts hordes of tourists each year. With such a high turnover of people using the borough as their base, it’s no surprise that its cleanliness has suffered as a cost of its hospitality.

On the other hand, the cleanest New York zip code, 11040 in New Hyde Park, only notched up a mere 176 complaints per 100k population. A quieter neighborhood nestled in the suburban sector outside of Queens, the New Hyde Park area is away from the hustle and bustle of Manhattan.

The dirtiest and cleanest zip codes in Los Angeles

With healthy green juices on tap and streets lined with Hollywood stars, you may not expect the glamourous city of Los Angeles to have an issue with cleanliness. Ranking as the fourth dirtiest city according to our analysis, the City of Angels isn’t quite as idyllic as the movies might have us think.

Ramping up a surprisingly high complaint rate is the affluent neighborhood of Mission Hills, an area boasting many local businesses and where most people own their homes.

04 Dirtiest Zip Codes in Los Angeles

Though ‘calm, quiet and friendly,’ according to one reviewer on Trulia, Mission Hills inhabitants are far from satisfied with the sanitation levels of their neighborhood. The 91345 zip code issues an average of 30,284 per 100k population.

On the other hand, the residents of Inglewood are the happiest with their sanitary conditions, issuing just 72 complaints per 100k population.

West Englewood is home to the dirtiest zip code in Chicago

The city of Chicago is also known for its abundance of greenery. Latin for ‘city in a garden,’ Chicago has adopted the phrase “urbs in horto,” and — with over 8,800 acres of nature preserves — it’s safe to say that the city breathes all manner of life. However, despite its lush surroundings, Chicago is surprisingly dirtier than New York and San Francisco, according to our research.

05 Dirtiest Zip Codes in Chicago

Coming in with 19,714 complaints per 100k population, West Englewood is home to the dirtiest zip code in Chicago. With 36% of the population of West Englewood living in poverty, it’s likely that residents of this neighborhood have multiple pressing issues to tackle — aside from the cleanliness of the community.

Elsewhere, the Loop of Chicago houses the cleanest zip code in the city — with only 792 complaints. Rich in architectural landmarks and cultural institutions, this central neighborhood is leading the way in terms of clean streets and low complaint rates.

Friendswood is the cleanest area in Houston

Famous for its contributions to science and space studies, the Texan city of Houston has many things to be proud of. It seems that its nationally recognized leader, Mayor Turner, has done a stellar job of managing the nation’s fourth-largest city. From zero income tax and a low cost of living to being the most ethnically diverse metropolitan city in the United States, the residents of the ‘Space City’ have a lot to be content with — and its sanitary conditions are no exception. According to our research, it’s positively sparkling in comparison to the likes of Baltimore and Sacramento.

06 Dirtiest Zip Codes in Houston 1

Tallying up a very small number of 19 complaints per 100k population, zip code 7756, located in Friendswood, is the area with the fewest sanitation issues. The conservative-leaning neighborhood is ‘one of the best places to live in Texas,’ is made up of a wealthy community and a top-rated public school system.

In comparison, it’s the Houston Gardens area that’s made the most complaints, with a much larger report rate of 19,168 from zip code 77,028. Though the home prices are far below the city’s average, it seems as though the neighborhood could do with a spruce — that’s if the hefty cleanliness complaint rate is anything to go by.

The dirtiest and cleanest zip codes in Philadelphia

According to our findings, the city of Philadelphia is on top of more than just its cheesesteaks. Set against the likes of Los Angeles, Charlotte and Memphis, Philadelphia is one of the cleanest cities in the United States, judging by its relatively small complaint rate of 2,144 per 100k population.

07 Dirtiest Zip Codes in Philadelphia

Still a low report figure in comparison to other cities, zip code 19146 — located in Southern Philadelphia — came in with the highest number of complaints with 5,840. South Philadelphia houses a dense population rate of 42,106 people per square mile, whose busy streets and overcrowded areas may contribute to its sanitation issues.

Comparatively, the area of Darby is home to the lowest complaining zip code, 19023, with only 109 reports per 100k population. Known as Philadelphia’s largest suburb, it appears that Darby offers a family-friendly, ‘world in one place’ neighborhood with very little to complain about. 

Some cities need sprucing more than others

With any city, hygiene issues are a given, and none of them can be completely clean. But some cities and zip codes are doing better than others at staying sanitary. To find out which urban areas are the dirtiest, input any U.S. city to discover which zip codes have the highest and lowest complaint rates. Explore the full data in our interactive table below.

So, if you ever find yourself wondering which American urban destination is the dirtiest, we’ve got you covered. Whether you’re yearning to move to another city and take advantage of a clean slate or want to take a vacation to the most sanitary side of Los Angeles, we’re here to help you sort out the dirty laundry and find the cleanest city spots in America.

Methodology

To find out which are the dirtiest cities in America, we analyzed the 12.3 million sanitation-related 311 complaints in a series of U.S. cities. We calculated the number of these complaints per 100,000 population, both on a city level and on a zip code level. Finally, we ranked the cities and zip codes by the number of complaints per 100K population.

We started the process by manually exploring which cities have 311 service call data in the United States, in which we selected the latest 365 days for every city to build up a uniform time frame. Then, we explored how the categories were named in each city. Upon close inspection, we selected 644 categories related to sanitation issues among an approximate total of ~6,000. These categories include some keywords such as waste, recycling, garbage, etc.

After this, we selected the records that matched the sanitation categories. For these records, we searched for the zipcode they belong to, if not disclosed, using either their latitude, longitude coordinates or their address. We removed the records we couldn’t find a match for or were formatted poorly.

Finally, we counted the number of sanitary complaints in every zip code and divided it by the population that the zipcode had to obtain the number of complaints per 100K population.

Important Note: some zip codes from each city’s 311 database refer to areas within the county area of that city, not just the city center itself.

Methodology Notes:

    1. Some cities were excluded as their 311 data did not include sanitary issues.

    2. We only report results for cities with more than 250K population and where at least 50% of their sanitary complaints were mapped to a zip code.

    3. We only report results for zip codes with more than 10 complaints and more than 10K population.

    4. City-wide complaints per 100K population considers both mapped and unmapped sanitary complaints.

The U.S. neighborhoods homebuyers are most interested In

An aerial view of an American suburban neighbourhood

Caught you looking!

They call it Zillow porn. And yes, viewing a desirable home online delivers a rewarding dopamine hit. But it also feeds our longing to improve our own lot and satisfies (or never quite satisfies) our curiosity to see inside the homes of others. Zillow counted 10.2 billion visits to its house listing site in 2021. Even allowing for multiple homes watched by genuine buyers, that figure reflects a nation of virtual carpet treaders.

And there is a lot more ‘looking’ than ‘doing’ right now. Sales of existing homes dropped by 19% between August 2021-22, while monthly mortgage payments rose by up to 59%. But with post-pandemic prices soaring, sellers have flooded the market — and with supply outstripping demand, prices are starting to cool. Buyers could be about to stop browsing and start spending.

High-interest rates and economic precarity mean that active American buyers will need to make some tough decisions. It could mean tightening the purse strings to make repayments affordable, or it could mean settling for a less desirable neighborhood. But which neighborhoods do we want to move to? HouseFresh analyzed Zillow user patterns to find out.

HouseFresh collected Zillow sales listings from America’s 100 most populous cities and identified each home’s neighborhood, the number of days listed on Zillow and the number of page views. We then calculated the page views per day for each listing and averaged the number of daily views across each neighborhood.

Key findings

  • Northeast Dallas in Texas is the neighborhood buyers are most interested in, with 36,113 daily views on Zillow.
  • Durham’s Warehouse District in North Carolina has just 12 daily views, the least of any neighborhood on Zillow.
  • The Upper East Side is New York City’s most desired ‘hood, with 24,125 daily views.
  • Central City East is LA’s least desired hood, with just 408 Zillow property views per day.

Northeast Dallas has something for everyone and is America’s most-sought neighborhood

Homebuyer outlook has changed since the pandemic hit. Owners have been thinking about second homes to escape to, bigger suburban houses with room to work from home… or downsizing while they rebuild their careers. This is reflected in Zillow view patterns, where relatively affordable areas stand shoulder to shoulder with more expensive, glamorous neighborhoods.

01 Most Interesting US Neighborhoods

Homes for sale in Northeast Dallas get the most views by a gap of nearly 4,000 per day. The average price is $465,173, a fraction of that in second-place Hollywood Hills ($2.3m). While LA’s celebrity mecca gets plenty of curiosity clicks, Northeast Dallas can likely attribute its popularity to genuine buyer interest since the market caters well to a wide range of property hunters including families, migrants and singles.

20 US Neighborhoods Homebuyers Least Interested In

House prices in Durham’s Warehouse District in North Carolina are up 15.9% in a year but remain reasonable (for a trendy area) at $305,830. As a small neighborhood with a lot going on, there are few properties for sale. This may create less of a buzz about buying around here, while local buyers may be looking to live a little more peripheral to the action (particularly during phases of aggressive redevelopment) — altogether bringing down the hits the area gets on Zillow.

Upper East Side property is New York’s most wanted

With homes averaging $1.43m (albeit with a relatively low 6.2% annual rise), it seems safe to assume that many of the 24,125 daily clicks on Manhattan’s Upper East Side properties are aspirational — the former ‘hood’ of  Rockefellers, Roosevelts and Kennedys is known for its grand residences. This neighborhood gets over 300 times more attention than New York’s most ignored location: Fordham (79 clicks). However, Fordham is one of the places where the cost of buying is most favorable compared to the cost of renting.

03 Most and Least Popular Neighborhoods for Homebuyers New York City

LA’s most-browsed neighborhood on Zillow is Hollywood Hills

LA’s most-browsed neighborhood has nearly twice the clicks as second-placed Encino (16,736). So, it is likely that many of the 32,216 daily property views on Hollywood Hills pads are from casual internet surfers hoping for a glimpse of how the glitterati live. However, it is a large area with a variety of smaller ‘sub’ neighborhoods, such as the “artsy, creative” Laurel Canyon and rustic Beachwood Canyon.

Most Popular Neighborhoods in Los Angeles

Lakeview is the jewel in Chicago’s crown

Area real estate broker Mike Opyd sings the praises of Chicago as a big city with low prices and neighborhoods that buck the general perception of Chicago life. “You could buy a two-bed, two-bath condo with parking in River North (our version of Manhattan) for around $500,000, which would be impossible in New York City,” says Opyd, while the LGBTQ+-friendly neighborhood of Rogers Park has average prices at $195,000. Picturesque Lakeview gets the most hits on Zillow, although — like many of the most desired spots — it is more expensive than surrounding neighborhoods.

05 Most and Least Popular Neighborhoods in Chicago

Pecan Park and Kashmere Gardens are less desirable than they sound

Despite their dreamy names, Pecan Park and Kashmere Gardens are the Houston neighborhoods in which buyers are least interested. The majority of homes in Pecan Park are rentals, and there is not as much green space as the name suggests. In fact, the area is bordered by interstates on two sides and is also troublingly close to local industrial facilities, raising fears about air quality. Conversely, three-quarters of Kingwood’s residents own their property, and the development has been built around a landscape of varying natural attractions.

06 Most and Least Popular Neighborhoods for Homebuyers Houston

Trendy but gentrified Fishtown among Philly’s hot spots

Philadelphia’s hoods get fewer daily clicks than the most popular areas in the other cities we’ve focused on, but the top five still pull in a combined 21,713 daily views. It may sound like a Pixar movie waiting to happen, but Fishtown is touted as “Philly’s truest harbor of artistic, culinary and musical action” and “America’s Hottest New Neighborhood.” Fishtown also has strong travel links, making it an attractive prospect for young professionals — while established residents face the hiked prices and social alienation that comes with a period of gentrification.

07 Most and Least Popular Neighborhoods in Philadelphia

When real estate gets realer

Ever wondered how many potential buyers are clicking around your district? We collected Zillow view data for hundreds of U.S. neighborhoods, and you can browse and search them all in the interactive table below.

The desire for safe shelter is a basic survival instinct, but the sequential desire to view ever-weirder and more wonderful homes you have no intention of buying is a very modern neurosis. And it’s an itch that buying your dream home won’t necessarily scratch, as one Guardian columnist’s encounter with a serial Zilllower demonstrates:

“Just to clarify, you bought a house, but you’re still looking at Zillow?” asked the columnist.

“Every day,” came the reply.

METHODOLOGY & SOURCES

We collated the 100 most populous U.S. cities from Wikipedia. Using Zillow, we collected listings of properties for sale in these cities, focusing on houses, townhomes, apartments and condos. In particular, we extracted information from the listings about the neighborhood, the number of days a property is listed on Zillow and the number of property page views. Where the indicated time was measured in hours, we converted this to days by dividing the number of hours by 24.

We then calculated the page views per day for each listing collected and computed the average number of daily views across all property listings in each neighborhood.

We excluded neighborhoods in all rankings that didn’t have at least ten listings.

The cities where air pollution has increased and decreased the most since 2019

Industrial chimneys belching out smoke

According to the World Health Organisation, in 2022, 99% of the world’s population is breathing polluted air. It’s not a new issue, either: air pollution and its health effects have been on humanity’s radar for thousands of years. But while the phrase ‘air pollution’ might conjure up images of thick smog and eye-watering smoke, the most harmful type of air pollution particles are invisible to the naked eye.

Particulate matter 2.5 (PM2.5) describes pollutant particles so small that they can pass into your bloodstream and cause a range of health problems. In fact, they’re responsible for the deaths of around 4.2 million people worldwide each year. As it won’t disappear completely anytime soon, the WHO wants to reduce average annual levels to no more than five micrograms per cubic meter of air (µg/m3).

Much of the world still has a long way to go in reducing harmful air pollution levels, but the good news is that some cities are making great strides toward cleaning up the air. With this in mind, our researchers at HouseFresh wondered: based on changing local levels of PM2.5, where in the world has air pollution improved — or worsened — the most in recent years?

For each of the 480 global cities in our analysis, we calculated the average air pollution level of the first nine months of 2019 and 2022 (measured in PM2.5 micrograms per cubic meter of air, or µg/m3). We then worked out the value difference between 2019 and 2022 to discover the cities where air pollution levels had increased or decreased the most.

Key findings

  • Out of 480 global cities, Dammam in Saudi Arabia has seen air pollution levels increase the most (+111.1µg/m3).
  • Ulan Bator, Mongolia, has seen air pollution levels decrease the most (-23.4µg/m3).
  • In Europe, Salamanca, Spain, saw air pollution levels rise the most (+5.1µg/m3), while levels in Skopje, North Macedonia, have dropped the most (-12.4µg/m3).
  • In the U.S., Miami (FL) and Salt Lake City (UT) saw air pollution increase the most (+1.8µg/m3), and Omaha (NE) saw the biggest decrease (-1.2µg/m3).

Which capital cities have seen the biggest change in air pollution levels?

Generated primarily by burning oil and wood, PM2.5 — also known as fine particles — is the most unhealthy type of particulate matter (particles of pollution suspended in the air) to breathe in.

While the WHO has made clear that even very low levels of PM2.5 can cause harm to someone’s health, its new guideline for average annual concentrations is five micrograms per cubic meter of air (µg/m3). In other words, any location with an average annual PM2.5 level higher than that is considered to have unhealthier air. For example, the average annual concentration of PM2.5 in Beijing, China, was 40.54µg/m3 in 2021 — much higher than the WHO guideline.

To find out how air pollution is changing in 70 capital cities around the world, we calculated the difference between local levels of PM2.5 in the air in 2019 and 2022. Explore our map to view our results.

01 Air Pollution Decrease World Map

Of all capital cities, Baghdad, Iraq, has seen the most drastic rise (+31.6µg/m3) in PM2.5 levels since 2019. One 2015 study found that 81% of PM2.5 from the city is “dominated by dust, sulfate, gasoline and diesel.” The biggest change for the better can be found in Ulan Bator, the capital of Mongolia, where PM2.5 levels have dropped by 23.4µg/m3.

Dammam, Saudi Arabia, has seen air pollution increase more than in any other city

Our data reveals the top 10 global cities where air pollution levels have increased the most since 2019. Claiming the unfortunate top spot is Dammam, Saudi Arabia, where local PM2.5 levels have risen by 111.1µg/m3 — more than any other city on the planet. Dammam is a significant center for the Saudi oil industry and is home to both the largest port in the Persian Gulf and the largest airport in the world. One study labels airports as “hotspots” for harmful PM2.5 air pollution.

02 Air Pollution Decrease Global Cities Ranking

Other cities have seen air pollution levels drop since 2019, none more so than Ulan Bator, Mongolia (-23.4µg/m3), previously declared one of the most polluted capitals on Earth. Multiple factors contributed to the city’s dangerously unhealthy air: not only is Ulan Bator situated in a valley that traps air pollution, but in the past, locals burned raw coal, plastic and rubber tires to tackle the extreme cold. Fortunately, a plan to improve air quality was launched in 2017, including a ban on burning raw coal.

In Europe, air pollution levels have dropped the most in Skopje, North Macedonia

Our analysis of changing air pollution levels in European cities reveals that Salamanca, Spain, has seen PM2.5 levels increase the most (+5.1µg/m3) since 2019. Another Spanish city, Palma, comes second (+3.7µg/m3). According to IQAir, vehicles are the main source of pollution in the country’s urban areas. On the plus side, both cities are required to introduce low-emission zones for vehicles from 2023 as part of Spain’s plan to reach climate neutrality by 2050.

03 Air Pollution Decrease European Cities Ranking

Skopje, the capital of North Macedonia, was once the most polluted capital city in Europe due to emissions from local industry, outdated cars and residents burning wood and plastic to keep warm. The good news is that local levels of PM2.5 have dropped (-12.4µg/m3) more than in any other European city since 2019. In recent years, concerned locals have been campaigning for better air quality, and the city’s Green City Action Plan has prioritized improving the air.

Air quality in Miami and Salt Lake City has worsened more than any other U.S. city

In the U.S., our analysis reveals that air pollution has increased the most in Miami, Florida, and Salt Lake City, Utah: in both cities, PM2.5 levels have risen by 1.8µg/m3 since 2019. Salt Lake City, in particular, is at a natural disadvantage when it comes to poor air quality: situated in a valley, the city is prone to a meteorological effect known as inversion, which is when the cooler air of the city is trapped underneath the warmer air above it, keeping pollution close to ground level.

04 Air Pollution Decrease US Cities Ranking

The situation is brighter in Omaha, Nebraska, where air pollution levels have decreased by 1.2µg/m3 since 2019 — more than any other city in the U.S. Raleigh in North Carolina has seen the next biggest drop in air pollution (-1.1µg/m3). In 2022, the Governor of North Carolina issued an executive order to increase the number of sales of zero-emission trucks and buses. According to the Environmental Defense Fund, transportation is one of the most polluting sectors in the state.

The cities where air pollution has increased and decreased the most since 2019

From one city to the next, air pollution levels can vary drastically. To find out how air pollution levels have changed since 2019 in a city of your choice, explore our interactive table below.

It’s only natural to be concerned about high levels of air pollution where you live. Fortunately, there are steps you can take to look after your health. If you’re in the U.S., you can use AirNow to find out what your local area’s Air Quality Index score is and follow their guidance depending on the result. This might mean limiting time outside on days with particularly high levels of air pollution. 

On a wider scale, making small changes to your daily life can help lower the level of harmful particulate matter in the air. For example, you might want to consider using public transportation, and if you do need to use your car, make sure you don’t leave it idling. If you want to make a bigger change, the American Lung Association has more information on taking part in their Healthy Air Campaign.

METHODOLOGY

Using data from aqicn.org’s World Air Quality Index for each city, we calculated the difference between the average PM2.5 micrograms per cubic meter of air (µg/m3) value for the first nine months of 2019 and the first nine months of 2022. A formula developed by AirNow was used to convert AQI PM2.5 into µg/m3 values.

The original data for New York City is split into its constituent boroughs, so we used the average value of pollution levels across all boroughs. Cities in Ukraine were excluded from the comparison due to the ongoing military conflict having an inevitable impact on the level of air pollution. The data was collected in October 2022.

The best and worst U.S. cities for your skin

Header The Healthy Skin Index 1

We’ve all had those days where our skin is not looking its best, despite doing all the right things to keep it happy and healthy. Lots of things can affect our skin from the inside out, like hormonal changes and health conditions, but if you’re having trouble with your skin, it might also be down to some environmental factors at play where you live.

Unhealthy levels of air pollution, for example, still affect more than 40% of Americans, despite great strides made by the U.S. government since the Clean Air Act of 1970. And while you might be aware that air pollution can cause a range of health problems when inhaled, did you know that it can also cause the skin to age prematurely and worsen conditions like eczema?

Air pollution is not the only environmental factor affecting your skin. Hard water (water with high levels of dissolved calcium and magnesium) and UV light from the sun are also proven to cause skin damage, with health problems resulting from exposure ranging from dry and itchy skin to skin cancer.

From city to city, individual measurements of air pollution, hard water and UV light will vary — but where in the country can you find the very worst skin health conditions based on all of the factors combined?

What we did

To find out which cities have the harshest effect on the skin, HouseFresh gave 328 U.S. cities a score for skin health. To create the index score, each metric (air pollution, UV light and water hardness) was given a weight of 33.33 to add up to 100 total.

Cities that were awarded high scores boast cleaner air, less UV radiation and softer water. Cities with lower scores have higher pollution levels, more UV radiation and harder water – and are subsequently worse for the skin.

Key findings

  • Scottsdale, Arizona, is the worst city in the U.S. for skin health.
  • The best city in the country for skin health is Auburn, Maine.
  • Cities in Arizona and California are among the worst for skin health.
  • Maine and five other states bordering Canada are home to the best cities for your skin.

The worst city for your skin in every state

We’ve given each U.S. city in our analysis an index score based on local levels of hard water, UV light and air pollution, with lower scores indicating that the city is worse for skin health. The map below reveals the lowest-scoring city in each state. The worst cities in the country include Scottsdale, Arizona (3.67), Corona, California (5.20), and McAllen, Texas (12.73).

01 The Healthy Skin Index US Map Hi RES

Skin health is important to many people in the U.S. One 2022 poll revealed that over half of Americans feel confident on a day when their skin feels and looks its best — which is probably one reason why the U.S. spends billions of dollars annually on skin care products.

Arizona and California are home to the worst cities for your skin

Our research reveals the 20 worst cities in the U.S. for your skin based on local levels of hard water, UV light and air pollution. Scottsdale, Arizona, takes the top spot with an index score of 3.67, which is lower than any other city in the U.S. Unfortunately for Arizonans, six different cities in the state also feature in our ranking, including Phoenix, but what makes the Grand Canyon state so unfriendly to your skin?

Not only is Arizona the sunniest state, exposing residents to high levels of UV light all year round, but it also scores poorly on air pollution levels. Inside the home, Arizona has some of the hardest water in the U.S., and residents spend more on air-conditioning — which can dry out the skin — to combat the high temperatures than anywhere else in the country.

02 The Healthy Skin Index Worst Cities US Chart Hi RES

Eight cities in California also feature in our ranking of the worst U.S. cities for skin health. Like Arizona, California has the honor of being one of the sunniest states as well as one of the least humid. Not only is humidity essential for keeping your skin hydrated, but research has shown that low levels of humidity in the air can cause wrinkles to form.

Maine and other states bordering canada are the best for skin health

According to our research, the kindest city on the skin is Auburn, Maine, with an index score of 95.1, followed closely by Bangor, also in Maine, with a score of 95. Five Maine cities appear in our top 10 rankings, including the state’s capital Augusta (92.6) and the worst-scoring city in the state (Portland: 88.6) still scores higher than the highest-scoring cities in 44 other states.

One factor behind Maine’s magic is that it boasts soft water, which lacks the high levels of minerals in hard water that can leave a residue on your body and cause dry and irritated skin. Another reason is that it is one of the most humid states, which can help to keep skin hydrated. Maine’s clean air is also a bonus, as high levels of air pollution can prematurely age the skin by causing wrinkles and age spots.

03 The Healthy Skin Index Best Cities US Ranking Hi RES

Every other city in our top 10 rankings is in a state that borders Canada. While Canada has some of the cleanest air in the world, the border region between Canada and the U.S. has enjoyed a reduction in annual ozone levels in recent years thanks to an ongoing agreement between the two countries.

Some of these states are also among the cloudiest in the country, but it’s a myth that sunlight can’t cause damage to your skin on cloudy days. While clouds do block some of the harmful UV rays from the sun, they don’t block it all and that’s why experts recommend wearing an SPF 30 or higher sunscreen every day.

The best and worst U.S. cities for your skin

Explore our table below to find out if your city ranks as one of the best or one of the worst places in the U.S. for skin health based on an index score that combines local levels of hard water, UV light and air pollution. The lower the score, the worse the city is for skin health.

How hard water, UV levels and pollution levels affect the skin

Did you know that your skin is your body’s largest organ? It’s also the most visible indicator of your age, which is why protecting yourself against the premature aging effects of UV light and air pollution is so important. These aging effects include yellowed and bumpy skin, wrinkles and age spots.

Too much exposure to UV levels can cause more dangerous health problems to develop, like skin cancer. In fact, getting five or more sunburns in your life more than doubles your risk of developing melanoma and your skin can be damaged by UV light even without an apparent burn.

Luckily, it’s relatively easy and inexpensive to protect yourself from skin damage caused by either UV light, hard water or air pollution. Read on for a breakdown of each factor’s harmful effects up close and for our tips on how to protect your skin’s health like a pro.

How air pollution affects skin

Take care of your skin wherever you live

To some people, the phrase “skincare routine” will conjure up convoluted images of cucumber slices, chemical peels and Patrick Bateman’s iconic morning ritual. In reality, taking care of your skin doesn’t have to be complicated or expensive and the benefits you’ll reap are worth the extra time you invest.

One easy thing you can do is cover up in the sun and wear an SPF 30 or higher sunscreen every day, even when it’s cloudy. Studies have shown that even applying an SPF 15 sunscreen daily reduces your risk of skin cancer by 40%.

Wherever you live in the country, and whatever your skincare routine, take care of your skin as best you can and make a note of anything out of the ordinary. If you have any skin concerns or notice any changes to a mole, speak to your doctor or a dermatologist.

Methodology & sources

Air pollution data was taken from the Environmental Protection Agency’s Air Quality Data and State of the Air report by the American Lung Association. A higher value represents more air pollution.

The UV Index Scale is a standard measurement of the strength of sunburn-producing ultraviolet radiation at a particular place and time. Usually ranging from 0 to 11 (higher = more ultraviolet radiation), an average figure was taken for each U.S. city across all the months of the year. UV index data was sourced from WeatherUS and WeatherWX.

Water hardness is measured in parts of calcium carbonate per million, with higher values signifying harder water and lower values signifying softer water. Data was collated from Hydroflow-USA.

Where possible, city-level data was used; however, where data wasn’t available at city level, metro- or county-level estimates were used instead. The final list of cities includes 328 cities, for which all three data points were available.

Each of the above metrics was given a weight of 33.33 to add up to 100 total and each city was scored on its air pollution, UV index and water hardness, with higher scores indicating being better for skin and lower scores being worse. High-scoring cities are places with cleaner air, less UV radiation and softer water. Cities with lower scores have higher pollution levels, more UV radiation and harder water.

The data was collected in August 2022.

The happiest cities and states in the United States

happy family ph jimmy dean 1

Instagram can tell you what’s new, what’s cool, and what’s for dinner. But can you use it to find happiness? The data analysts at HouseFresh reckon so, and we’ve processed thousands of Instagram selfies to find the happiest places in the U.S. – and those places where intense smiles are more common than genuine joy.

Happiness may be hard to find, but it’s even harder to fake. A generation of internet users has grown up with everyone always looking happy on Instagram, and they’ve figured out how to tell the difference. No matter how much you rehearse or how many discarded snaps end up in your phone’s trash, people have learned to piece together the clues from your selfies and figure out how you really feel.

Thankfully, robots are selfie-literate, too. Artificial intelligence can identify every face in a crowd, but it can also identify every emotion in a selfie. So, we put technology to the test.

What we did

We used Microsoft’s face recognition API, Azure, to analyze a database of Instagram selfies from every state and the 100 biggest U.S. cities to see which are the happiest places to live.

This facial recognition tool places numerical estimates on emotions based on characteristics and expressions. To work out the happiest cities and states, we used the FaceAPI happiness score, averaging all the scores in each location. For the smiliest cities and states, we considered that a face has a smile if its smile score was greater than 0.75. The locations were ranked by the percentage of people smiling.

Key findings

  • Utah, is the happiest and smiliest state in the US, with a happiness score of 74.4 out of 100 and 70.7% of photos containing a cheery grin.
  • Location matters – 8 of the 10 most cheerful states lie west of the Mississippi River.
  • America’s happiest city is Concord, California, with a happiness score of 79.1 out of 100. With nearly three-quarters of residents (74.4%) grinning in their photos, it’s also the smiliest.

How happy is America, according to AI?

We compared both “happiness” and “smiliness” because not every smile indicates happiness, and not every happy person smiles. After all, plenty of perfectly happy men choose not to smile in selfies because they suffer from man selfie face (lips in, eyebrows up, earnest). And some of the world’s most successful people ration their smiles in favor of pouting like an actual sparrow (parting your lips slightly, like a baby bird waiting to be fed).

01 Say Cheese Happiest Cities and States Mini IG

Click here to see this image in full size

And then, there are the Hide Your Pain Harolds (named after the famous stock photo actor/meme whose forced smile fails to mask profound existential discomfort). The average Harold pic would probably hit 100% for intensity but not fare so well on actual happiness. A city full of Hide Your Pain Harolds might not be very happy, but it would be incredibly smiley. Would you like to live in a place like that?

Utah is happiest U.S. state – and boasts the most intense smiles

First, we mapped the happiest and smiliest states. Utah is number one in both regards, suggesting that when someone in Utah smiles, they really mean it! Surprisingly, California has the least happiness and the fewest smiles – maybe those Hollywood celebs are saving their best smiles for the silver screen. But between Utah and California, several states show some disparity between their placing for happiness and their position in the smiliest charts.

02 The Happiest States in the US Map

Click here to see this image in full size

Michigan ranks 23rd for smiles (average 57.63% smile intensity) but is actually the 14th happiest state in the U.S., according to a full emotion analysis of the state’s selfies (average 64.92% happiness score). The difference might be explained by the nature of happiness in Michigan. A happiness less defined by ‘delight and joy’ and more by resilience, faith, and… proximity to water?

03 The Smilest States in the US Map

Click here to see this image in full size

Meanwhile, all is not well in Massachusetts – but they’re putting a brave face on it. Only four states have lower happiness ratings than the Bay State: Pennsylvania, Indiana, New Jersey, and California. But nine rank lower than Massachusetts for the intensity of their smiles. The famous ‘yellow smiley face’ icon-turned-emoji was (probably) invented in Massachusetts in 1963. The designer, Harvey Ross Ball, was paid just $45 for his work, and if he were alive today, his smile would probably be more “Hide Your Pain Harold” than “face with tears of joy.”

Concord, CA, is U.S. capital of the genuine smile

04 The Happiest Cities in the US Map

Click here to see this image in full size

On a citywide scale, Concord reverses the trend of its home state California, boasting both the highest average happiness rating and most intense smiles. The hometown of Tom Hanks is said to be a quiet and pleasant place to live: moderately wealthy, moderately liberal, and more affordable than similar cities nearby.

05 The Happiest Cities in the US Top 20

Click here to see this image in full size

The top 20 happiest cities in the U.S. closely match the top 20 smiliest – there’s little disparity between those that smile and those that appear genuinely happy. Exceptions are Denver and Pittsburgh, which make the top 20 for happiness without forcing the smiles necessary to rate among those with the most intense smiles.

06 The Smilest Cities in the US Map

Click here to see this image in full size

The two unique entries among the 20 smiliest cities are Worcester, MA, and Denton, TX. Massachusetts again? Yep – Worcester is the city where Harvey Ball invented the smiley face. Worcester has nicknamed itself Smile City and even issues Smile City Passports offering discounts and offers at local businesses. No smile required, although the odds are you’ll be smiling intensely anyway.

07 The Smilest Cities in the US Top 20

Click here to see this image in full size

Leonardo da Vinci vs. the Robots

Instagram’s most popular faces have learned the places that get the most Likes and headed there one after another to get a smiley selfie. It makes it harder to discern the happiest places to live or visit, which is why we’ve provided the results of our full AI analysis in the interactive table below.

From the Mona Lisa to Hide Your Pain Harold, a smile goes furthest when it hides more than it shows. In the case of the Mona Lisa, the painter Leonardo da Vinci understood more about the subtlety of human facial expression than perhaps the robots ever will. Perhaps it’s just as well he’s not around to comment on Instagram selfies from Worcester or anywhere else in Massachusetts today.

Methodology and sources

To calculate the happiest cities and states in the U.S., we used Microsoft Azure’s Face API. This facial recognition tool places numerical estimates on emotions based on characteristics and expressions.

We analyzed images from each state’s Instagram page, as well as from the top 100 U.S. cities by population.

To work out the happiest cities and states, we used the FaceAPI happiness score, averaging all the scores for the faces detected by FaceAPI in each location.

For the smiliest cities and states, we considered that a face has a smile if its smile score was greater than 0.75. The locations were ranked by the percentage of people smiling.

The most beautiful gardens in the world, according to tourists

Bushart Gardens Victoria Canada

“Upon my life, I believe handsome public grounds, with music, would have the happiest influence in allaying riots and debauchery, crime and secret vices,” declared landscape designer Andrew Jackson Downing in 1848. 

The public garden was late to the U.S. In Europe, the Italian Renaissance had ushered in a culture of open grounds of variously scientific or aesthetic appeal. But it took until the 19th century for the U.S. to notice the benefits that the grand garden could have on the soul of both the individual and the nation.

The romance flourished as urbanization put a tighter squeeze on our natural spaces. A public garden immerses you into a world of landscape design and natural wonder. It offers education if you want it and meditation if you need it, a short pedal or stroll from your door. And when you travel, the gardens on show harbor local history, design, and indigenous plant life away from the bustle of the city or beach.

Andrew Downing had earlier raved that public gardens provide “room and space enough for pleasant little groups or circles of all tastes and sizes, and no one is necessarily brought into contact with uncongenial spirits.” Sadly, this social appeal of the public garden caused most to politely close during lockdown. So, as these gardens re-open for human visitors, HouseFresh analyzed Tripadvisor reviews of nearly 1,000 landmarks to find the most picturesque public gardens that are overdue for your contemplation: the gardens that the most reviewers called “beautiful.”

Key Findings

  • Gardens by the Bay in Singapore is the most beautiful public park in the world, with 12,385 “beautiful” mentions on Tripadvisor.
  • Bellagio Conservatory & Botanical Garden is the most beautiful public park in the U.S., with 5,706 mentions.
  • Seven out of the top 20 most beautiful public parks in our study are in Europe.
  • Luxembourg Gardens in France is Europe’s most beautiful public park (6,818 mentions).

Futuristic Singapore landscape is the world’s loveliest public garden

A public garden offers a restful escape from the touristic thoroughfare. Your host city might boast a variety of public garden types, such as the botanical garden (offering a more scientific angle or a collection of rare or exotic plants), arboretum (tree garden), or gardens with a different design principle or cultural emphasis. We found the most beautiful one in each country and mapped them below.

01 The Most Beautiful Gardens World Map

Click to see full-size image

There is a good spread of top-rated public gardens around the world. Our top ten includes landscapes in Asia, Africa, North America, Europe, and Oceania. However, seven of the top 20 are in Europe, indicating the importance of European royal and pleasure gardens. These have long alternated between the Baroque-tinged geometrics (such as Luxembourg Gardens, France (below)) and a wilder landscaped layout.

The world’s most beautiful public garden boasts three waterfront landscapes and the world’s largest glass greenhouse. Since opening in 2011, Gardens by the Bay has been the cornerstone of Singapore’s claims to be the premier tropical garden city. An aerial walkway through the ‘Cloud Forest’ and a cascade of orchids down the futuristic walls of the greenhouse are among the hypermodern features of this blissful resort.

“Stay for the sound and light show,” recommends one reviewer, “where many of the sculptures are lit up with varying colours and patterns to the background of beautiful opera and music.”

Glam Las Vegas Conservatory is the most eautiful in the U.S.

A wander around a public garden, taking your phone from your pocket only for a discreet Instagram moment, has a whiff of the Victorian wellness retreat. But it has come of age as we’re driven to add gardens to roofs and interior walls in an attempt to save our planet and our mental health. Wherever you are in the U.S., there’s probably a secret paradise a short trip away. This map pinpoints the most beautiful in every state.

02 The Most Beautiful Gardens US States Map

Click to see full-size image

The most beautiful public garden in the U.S. is rated 53% more beautiful than the second-placed Boston Public Garden. Bellagio Conservatory & Botanical Garden is a key feature of the eponymous Las Vegas hotel, delivering curated flora from around the world. Granted, the heavily-designed gardens offer a space more suited for entertainment than meditation. But, this being Vegas, every last detail is attended to your satisfaction.

“It is so beautiful and such a pleasant way to spend some time away from the noise and chaos that is Vegas,” testifies one visitor. “A happy place and time!”

You only need to utter the words “Japanese garden” to lull some horticulturalists into a state of meditation. A visit to Portland Japanese Garden will show you why. Rather than strict rules, a Japanese garden harnesses a mindful sense of proportion, grace, and mutability, with attention to local needs and materials rather than a zoo-like import of exotic plants and techniques. 

Portland Japanese Garden achieves this while embracing core values of “Inspiration, serenity, tranquility, and the aestheticism of nature.” The Japanese ambassador once described it as “the most beautiful and authentic Japanese garden in the world outside of Japan.”

A sense of enormous well-being

The joys of the public garden are many: “health and spirits,” suggests Andrew Downing, “exercise in the pure open air, amid the groups of fresh foliage and flowers, with a chat with friends, and pleasures shared with them, as compared with a listless lounge upon a sofa at home, over the last new novel or pattern of embroidery!”

So, rise up, “fair countrywomen” (and everyone else), from your embroidery station or hotel bed, and breathe in the colorful wonders of a nearby botanical park. You can search our full data below to find one. You’ve nothing to lose but your cobwebs.

METHODOLOGY 

Throughout December 2021, we used Tripadvisor to gather data on the most beautiful gardens in the world by searching Things To Do using the keyword “beautiful” in each country of the world and each U.S. state. Then, we extracted the attractions labeled as gardens.

We deemed the places with the highest number of mentions of “beautiful” in their reviews were deemed the most beautiful gardens.

How air pollution could ruin our most beloved views

Header Tainted Views 1

For a moment, every neighborhood radiated the glamor of a picture postcard landmark.

When the first 2020 lockdown struck, a temporary bonus was the drop in air pollution. The view through our windows seemed freshly polished. Tourist attractions shone with an intensity unseen for decades. Environmentalists keenly told us that this was a wake-up call, not a turning point. Despite decades of campaigning and policy change, air pollution is still worsening for more than half the world’s population.

You might not notice the worsening effect in your daily, hometown life. But when you travel, the sight of industrial smog has a sobering effect. As part of our mission to draw attention to the quality of the air you breathe, HouseFresh wanted to show you how 10 famous views could look if local human-made air pollution levels increase.

We found iconic photos of the views and, on each one, emulated the visual effect that air pollution has on the skyline of Ghaziabad, India, frequently ranked as the “most polluted city worldwide.” At the time of writing, the PM2.5 level in Ghaziabad is 18.2 times the WHO annual air quality guideline value, with an Air Quality Index (AQI) of 169. A ‘Good’ rating is 0-50 AQI.

Use the sliders below to reveal ten of the world’s loveliest views now and how they could eventually look if air pollution levels rise unchecked to Ghaziabad levels.

Rockefeller Center (New York, USA)

In the 20th century, New York City was the poster child for the modern city. And the 1939 Rockefeller Center was an art deco emblem of American sophistication. But, as early as the 1960s, the eroding effect of air pollution on its buildings was cause for concern. Today, the Department of Environmental Protection suggests that 6% of NYC deaths are connected with air pollution.

The Shard (London, UK)

The “imposing and majestic” Tower Bridge, seen here from up in the Shard, was built to facilitate urban commerce in the late 19th century – just a few years before a London doctor, Harold Des Veaux, invented the word ‘smog’ (smoke + fog). But the pollution of London air by the burning of coal predates the Victorian bridge by at least six centuries. In 2021, the city’s mayor unveiled a 10-point plan to reduce air pollution, pointing out that “there is a significant peak in concentrations during the morning school run.”

Christ the Redeemer (Rio de Janeiro, Brazil)

It took nine years to build the 130-foot concrete Christ into Rio de Janeiro’s skyline. But that skyline has since been tainted by the fumes of Brazil’s main steel complex as well as numerous other industrial sites. And the city failed to reduce air pollution “within the limits recommended by the World Health Organization” as promised ahead of the 2016 Olympics. 

“A lot of attention has been paid to Rio’s water pollution, but far more people die because of air pollution than the water,” declared Paulo Saldiva, a University of Sao Paulo pathologist and WHO committee member. “You are not obligated to drink water from Guanabara Bay but you must breathe Rio’s air.”

Victoria Peak (Hong Kong)

Victoria Peak is a must-visit when in Hong Kong, offering contrasting views from the hills to the cyberpunk cityscape – and a rare breath of fresh air. Unfortunately, the air down in the city is1n’t as fresh. The annual hours of reduced visibility in the city near-quadrupled from 295 to 1,100 in the two decades leading up to 2008, seriously reducing your chances of an Instagram moment. By 2016, the city’s largest coal and gas power stations were churning out 8,020 tons of sulphur dioxide and 310 tons of PM2.5 pollution.

Centre Island (Toronto, Canada)

Centre Island is one of the world’s largest car-free (or at least car-resistant) urban areas. As a veritable Ontario oasis, the Toronto Islands are the site of hearty, outdoor pastimes and sunset selfies. Unfortunately, the air from nearby forest fires drives the region up as high as second place in the ‘world’s worst air’ challenge – with the altered skyline almost grotesquely beautiful.

Mrs. Macquarie’s Point (Australia)

Elizabeth, wife of Governor Macquarie, had a seat chiseled into the peninsula that has borne her name since 1810. The chair remains today, but the view has changed, first with the iconic expressionist ‘shells’ of the Sydney Opera House, and later with the onset of headline-grabbing smog levels. In addition to motor vehicle exhausts, bushfire smoke has been known to drive the Sydney air 11 times over the ‘hazardous’ limit, obscuring the Opera House and Harbour Bridge from view. Power station fumes and occasional dust storms also contribute to Sydney’s smog problem.

Montparnasse Tower (Paris, France)

In addition to the beauty and romance of the Eiffel Tower, the industrial revolution introduced serious air pollution to Paris, which is now the second most polluted city in France. A 2019 court case found that the state was taking insufficient measures to protect Parisians from poor air quality, with a contemporaneous study suggesting it will take 20 years for the measures to bring Parisian air quality under the European Limit Value. Local efforts to hasten improvements include the pedestrianization of city center roads, adding protected bike lanes, and banning cars made before 1997.

St. Peter’s Basilica (Rome/Vatican City, Italy)

This 400-year-old Renaissance-style church is a beacon for pilgrims of Catholicism, history, and architecture alike. But, until a recent renovation, a closer look at the walls of St. Peter’s Basilica would reveal black crusts, white erosion patches, and other discoloration due to air pollution. Rome is not an industrial city, but packed roads and a high proportion of diesel vehicles have blighted its historic views. Pope Francis has attributed the effects of pollution to our “predatory attitude, which makes us feel that we are masters of the planet and its resources, and authorizes us to make irresponsible use of the goods God has given us.”

Kerry Park (Seattle, USA)

Kerry Park is a popular spot for photographers seeking a shot of Elliot Bay, the Space Needle, and even Mount Rainier when the sky is particularly clear. But pollution from motor vehicles, outdoor burning, and wood smoke is now a common blight on Seattle’s views and breathability. While outdoor fires are discouraged – lately with regard to aggravating Covid-linked respiratory conditions – wildfires remain a serious issue. Air conditioning is rare in the city but becoming more common as homeowners try to alleviate the effects of wildfires and heatwaves. 

Tokyo Skytree (Japan)

The world’s tallest tower is used for television broadcasts and observation – including monitoring local air quality. You will also find a sky restaurant, “the world’s highest skywalk,” and observation decks with dizzying views of one of our most iconic cityscapes. Tokyo has monitored air quality since 1927 and regulated towards the offset of industrial and vehicular pollution since World War II through urban planning, traffic control, and even canceling of a planned petrochemical complex. However, today Tokyo’s PM2.5 levels remain two points above the WHO’s guideline figure.

Ultimately, the effects of air pollution on our beloved views may be a gift in disguise. Poor air quality tends to go unnoticed day-to-day, and it takes events such as Beijing’s orange skies – or the unusually blue skies of lockdown life – to draw attention to the air we breathe.

But seven million people still die each year from air pollution-related causes. The World Health Organization recently warned that bad air is more dangerous than previously thought, reducing its maximum safe levels and suggesting that “almost 80% of deaths related to PM2.5 could be avoided in the world if the current air pollution levels were reduced to those proposed in the updated guideline.”

Even in areas where air quality is improving, there is a long and smoggy road ahead to reaching safe levels of PM2.5. On a personal level, you probably can’t do much to redeem these beloved and tragically obscured views, but you can regulate the air quality in your immediate environment. While house plants may have some limited effect (and are lovely all the same), the most effective way to do so is with a home air purifier.

METHODOLOGY & SOURCES

We curated a list of the most beautiful city views around the world, pulling examples from articles from Insider, RTE, and The Times

The air pollution levels for each city with regards to PM2.5 concentration were sourced from IQAir.

The sliders show how the views in each city might look if pollution levels reached that of Ghaziabad, India, the second-most polluted city in the world, according to IQAir. The most polluted city in the world is Hotan, China, which reports air pollution predominantly as a result of desert dust storms rather than man-made pollution, which is why we chose the second-most polluted city.

To replicate the visibility levels, we sourced images that convey the smog levels experienced in Ghaziabad.

The data was collected in February 2022.

Every country’s most popular houseplant

V2 Header Most Popular Houseplants

It’s the romance of the century: the houseplant has wrapped its tendrils around humanity’s heart, and it won’t let go.

The millennials started the affair. Filling their rental properties with greenery. Taking ‘shelfies’ to supplement their Instagram selfies. Then, annual gardening revenue in the US grew by 4.62% in 2018, as Gen Z left home and joined the houseplant craze. And just like any other relationship, the pandemic intensified things. In 2020, growth nearly doubled to 8.79%, with stores swamped by ten times the daily orders they expected.

Along with the pandemic, plant passion went… well, if not viral, then rhizomatic, spreading and sprouting in countries around the world. An indoor plant is a hobby, a shoulder to cry on, a rosary for our existential fears, and an interiors flex on Zoom. So the world bought houseplants.

But some houseplants get more love than others. HouseFresh analyzed Google search data for the 230 most-Instagrammed houseplants to find out which one is the most popular in every country around the world. And we mapped every one, lining each territory with its most-searched houseplant.

Key findings

  • The Monstera deliciosa (Swiss Cheese Plant) is the number one plant in Europe, Asia & Oceania, and a joint favorite in North America.
  • The colorful Passiflora caerulea (Blue Passion Flower) is most popular in South America. This semi-evergreen climber is the national flower of Paraguay.
  • Africa’s favorite houseplant is the Lantana camara, an evergreen flowering shrub within the verbena family.
  • In the Middle East and Rest of Asia, they favor the Nerium oleander, an evergreen ornamental shrub that has been cultivated since ancient times and features in many of the Roman wall paintings in Pompeii.

North America

A monster is stomping all over North America. Monstera deliciosa is the most popular houseplant in Canada, Costa Rica, and the United States. The giant, hole-ridden leaves covering much of the continent map below have earned Monstera the nickname Swiss cheese plant. The fruit is indeed edible – tasting of paradise if ripe and bleach-like if unripe. (And not of cheese.)

01 Most Popular Houseplants North America

Mimosa pudica is also favorite in three countries: Jamaica, Trinidad and Tobago, and Belize. Known as the sensitive plant, its grey-green leaflets will shy away if touched, and its alternative nickname – shame plant – makes it the perfect confidant for your own festering self-hate. Plus, the pudica’s lilac pom-pom flower is quietly stunning.

South America

The blue passionflower is a multi-story bloom with tremendous architectural flair. The aerial view of Passiflora caerulea covering Argentina, Colombia, Uruguay, and Venezuela below cannot do justice to the manner in which the passionflower reinvents itself from leaf to petal base to reflex circle to coronal filament. The plant’s name is inspired by the suffering and death of Jesus Christ, and its tendrils cling to walls and trellises, making for a serious welcoming party at your front door.

02 Most Popular Houseplants South America

Although the blue passionflower is Paraguay’s national flower, it is not the nation’s top houseplant. Paraguay and Puerto Rico both search for Kalanchoe daigremontiana more than any other greenery. The “unique and undemandingmother of thousands is nicknamed for the endless plantlets that appear along its leaves. This ribbed effect also earns the plant the name of Devil’s backbone or alligator plant.

Europe

Much of Europe has been conquered by the Swiss cheese plant. Ten countries, including Switzerland itself, search for this houseplant more than any other. Which is a good chance to add a factoid on North America and Europe’s favorite shelf candy: its Swiss cheese holes evolved to filter sunlight through the rainforest canopy onto each leaf more or less equally, keeping the plant healthy all over and not just at the top. Try it with your Anglepoise lamp!

03 Most Popular Houseplants Europe

The second-most common favorite plant in Europe is the Hedera helix, the most-searched in four Balkan countries (Bosnia and Herzegovina, Macedonia, Moldova, Montenegro). Well known as Common or English ivy, it makes a great indoor plant since it tolerates moderate light, clears the air, and there is an enchanting range of leaf varieties to enjoy close-up. Plus, common ivy can be cultivated to fill a range of spaces and interior terrains.

Middle East & Central Asia

It looks Asian, the Romans painted it all over ancient Pompeii, and it grows magnificently in the cooler temperate climates of the UK or New Zealand – but Nerium oleander is so popular that nobody knows where it began. Simply known as oleander, this evergreen shrub is an eyecatcher in red, pink, purple, or white, but it’s highly toxic, so best kept away from cats, dogs, and toddlers. Oleander is favorite in Jordan, Kuwait, and Oman, the highest number of countries for a houseplant in this region.

05 Most Popular Houseplants Middle East And Central Asia

Palestine favors an unusual succulent called Pachypodium lamerei. Translating as ‘thick-footed,’ the plant’s stems swell with water storage tissue protected by sharp spines up to 5cm long. It also photosynthesizes through these stems. Should it be damaged, the lamerei bleeds white sap profusely. Way up over its impressive foot-trunk, joyful leaves sprout, which – along with the plant’s exotic origins – wins it the common name, Madagascar palm.

Rest of Asia & Oceania

The top houseplant in this region is again the Monstera deliciosa, which is the most popular in 11 countries. But the pandemic has fueled a growing passion for searching out rarer plants, as one Thai nursery owner explains: “It varies from person to person. Some people like to have something a bit different, others just love the thrill of the chase.”

06 Most Popular Houseplants Rest of Asia And Oceania

Japan is the only country in the world to favor the Kalanchoe tomentosa. It’s a cute one. The perennial succulent’s furry green leaves have dabs of brown on the end, earning it the name panda plant or chocolate soldier. The chocolate soldier (yes, we’re going with that one) originates from Madagascar, and in cooler climates, it actually needs you to have it indoors with you to keep it warm.

Africa

Lantana camara is the number one houseplant in 12 African countries. Its flower explodes in shades of red, orange, yellow, blue, white, and pink, releasing a scent that divides audiences into two camps – those that think it smells pleasantly fruity versus those who detect cat pee-like undertones. Lantana is considered by many to be a weed as it has spread eagerly through areas where it is unwelcome. But this fecundity just shows how easy it can be to grow from scratch.

07 Most Popular Houseplants Africa

The island country of Cape Verde takes a pretty dwarf tree, Polyscias fruticosa, as its favorite houseplant. Known also as Ming Aralia, the perennial can grow to a couple of meters in height but lends itself to the art of bonsai trees (pot plant ‘training’). Its fern-like leaves more than make up for the fact that the Ming Aralia rarely flowers indoors.

Love life, love plants

The present houseplant boom reflects the times in which today’s young adults have grown up – and the future that we face. An instinct has kicked in to surround ourselves with greenery and to ‘nurture nature.’ However, the trend can backfire when the same capitalistic forces that got us here manifest in the houseplant ‘industry.’

To keep indoor plants responsibly, experts suggest:

  • Buying local to reduce ‘plant miles.’
  • Rejecting plastic pots in favor of recycled and recyclable materials.
  • Avoiding retailers who use peat.

With that in mind, here’s the full data on the favorite houseplant of every country around the world… dig in!

METHODOLOGY & SOURCES

We curated a list of popular houseplant species based on a seed list of the 230 most-Instagrammed houseplants across the globe, according to research from NeoMam Studios for Budget Direct Home Insurance.

We then gathered the monthly Google search volumes for each botanical name in each country using Ahrefs Keyword Explorer. Where several species had the same number of searches in a country, we picked one with the lowest global search volume.

The data was collected in October and November 2021.

These are the most humid cities in the world

Header Humid cities

Extreme heat events are becoming more common as the climate warms. Cities around the world, but particularly in the Global South, are scrambling to cope, their buildings and infrastructure not designed to counter such dangerous temperature levels. This heat leads to humidity. And humidity — the amount of water vapor in the air, or that muggy feeling — can lead to fatigue, fainting or worse.

“If you’re sitting in the shade with unlimited drinking water in California’s Death Valley, conditions may not be pleasant, but they’re survivable,” says Colin Raymond, a climate scientist at NASA’s Jet Propulsion Laboratory in Southern California. “But in humid regions, once you approach wet-bulb temperatures of 34-to-36 degrees Celsius (93-to-97 degrees Fahrenheit), it doesn’t matter what you’re doing. You can’t survive for extended periods of time.”

Heat and humidity can feel particularly intense in the city. And the World Economic Forum predicts that the percentage of the world population living in cities will rise from 55% now to 80% by 2050. With more dramatic steps needed by both urban institutions and city-dwellers, we identified the most humid cities in the world and ranked every major city by the number of days per year that each major city is humid.

Key findings

  • Honolulu (Hawaii) is the most humid major U.S. city, with 337.1 uncomfortably humid days per year.
  • Singapore, Macapa (Brazil) and Cartagena (Colombia) are among the most humid global cities, with 365 uncomfortably humid days per year.
  • Portsmouth is the most humid UK city, with 11.7 uncomfortably humid days each year.
  • Hamilton is Canada’s most humid city, with 52.7 uncomfortably humid days per year.
  • Cairns is Australia’s most humid city, with 315 uncomfortably humid days each year.

We analyzed Weather Spark’s humidity data for 14,657 major cities to find how many days in 2023 each experienced a dew point of at least 16°C (60°F). We ranked cities with the most days above this level as the most humid.

Dew point is the temperature at which perspiration evaporates from the skin, cooling the body, so higher dew points feel more humid. This makes it a more accurate measure of how muggy it feels on a given day compared to relative humidity.

Before we dive into the results of our study, have a read at the mini-infographic below to learn more about the difference between relative humidity and dew point:

Difference between dew point and humidity

The most humid cities in the United States

We ranked America’s top 20 most humid places, based on the number of uncomfortably humid days they experience each year.

We found that Honolulu in Hawaii is the most humid major U.S. city, with 337.1 days per year when the dew point is 16°C (60°F) or over. However, Florida is the state with the most major cities among America’s most humid. There are seven Florida cities in the top ten, each with over 208 days per year of high humidity.

02 Humid cities US ranking

Honolulu is significantly more humid than any major U.S. city outside of Hawaii. The island state is more than 2,000 miles from the main continent and is surrounded by sea with a surface temperature that rarely dips below 22 degrees, causing moisture to rise from the ocean and contributing to humidity.

However, the humidity is far from uniform in Hawaii. The dramatic lay of the land plays a major part in modulating weather effects, and winds rushing down from the mountains can dry the air, worsening another climate-related threat: wildfires, such as those that engulfed Maui last summer.

The most humid city in every state

We mapped the city in each U.S. state that experiences the most uncomfortably humid days annually, with Kailua in Hawaii taking the top spot.

Our study shows that the most humid Hawaiian cities eclipse mainland humidity levels. For the map below, we expanded from major cities to include all U.S. cities with a population of more than 10,000 people. We found that Kailua, to the north-east of Honolulu on the island of Oʻahu, is the most humid city of this scale in America, suffering from 342.9 humid days per year.

03 Humid cities US map

The second most humid city with a population of over 10,000 is Homestead, joining its larger Florida neighbors Miami, Orlando and Sarasota among America’s muggiest places. Homestead suffers from 301.5 humid days per year. Local farmworker Efraín López García died at work in Homestead on July 6, 2023 — the hottest day on record — having suffered “symptoms consistent with heat illness,” according to NBC News.

“All of this could have been prevented with the right legislation,” said Yvette Cruz, Farmworker Association of Florida spokesperson. “All we ask is for four basic things: water, shade, breaks and to work with somebody — not to be left alone.”

The most humid cities around the world

We analyzed worldwide humidity data to identify the city in every country that experiences the highest number of uncomfortably humid days each year.

There are seven countries worldwide with cities that have constantly high humidity (365 days per year). Four of these are in Asia, and two are in South America, with Libreville in Gabon, Africa, the seventh.

04 Humid cities World Map 1

The most humid cities in North America

We ranked the top 10 places across North America that experience the most uncomfortably humid weather.

No North American countries are among the global top 20. But San Pedro Sula in Honduras suffers uncomfortably high humidity 363.5 days a year, so it is not far behind. The city is hot throughout the year but may be a little less humid in April when it tends to rain less.

05 Humid cities North America

There are two Mexican cities among North America’s most humid. Cancun suffers from 348.3 uncomfortably humid days per year. The tropical climate and location on the Caribbean Sea combine to create a warm, damp atmosphere, particularly between June and October when it is rainier. To the west of the continent, Acapulco suffers even worse humidity, with Pacific Coastal conditions exacerbated by harsh trade winds.

The most humid cities in Europe

These 10 European cities experience the highest number of uncomfortably humid days each year.

Next, we looked at Europe, where the humidity level among the most humid major cities is lower than on any other continent. Nine out of the top ten cities are in Spain or Italy, where the climate and moisture from the Mediterranean combine to keep things muggy through the summer months.

06 Humid cities Europe

The south of Europe also feels the knock-on effects of African weather events. “The bubble of hot air that has inflated over Southern Europe has turned Italy and surrounding countries into a giant pizza oven,” explained Hannah Cloke, a University of Reading climate scientist, during the European heatwave last summer. “The hot air, which pushed in from Africa, is now staying put with settled high-pressure conditions meaning that heat in warm sea, land and air continues to build.”

The most humid cities in Asia

We ranked the top 10 most humid places across Asia, with Balikpapan in Indonesia taking the crown.

Our data shows that Asian cities are the most humid of all. In fact, the entire top ten suffers from humidity 365 days per year. In order to rank them, we calculated the number of days each city spent at an extreme level of humidity (24°C/75°F dew point or more). By this metric, Balikpapan in Indonesia is the most humid, suffering 365.0 humid days and 268.8 extremely humid days per year.

07 Humid cities Asia

Asia is particularly susceptible to humidity due to its geographical layout, with vast mountainous regions, proximity to warm seas and intense monsoon seasons creating a “hothouse atmosphere.” Four of the most humid major Asian cities are in the Philippines. Humidity levels reached as high as 97% in May 2023. A 2019 report from the Institute for Economics and Peace suggested that the Philippines is the country most at risk from the climate crisis.

The most humid cities in South America

Below you’ll find a ranking of the South American cities with the highest number of uncomfortably humid days per year.

All of South America’s ten most humid major cities are in Colombia or Brazil, and all suffer 365 humid days per year. (As described above, we separated them based on how many days each city spent at an extreme level of humidity of 24°C/75°F dew point or more.)

08 Humid cities South America

Cartagena in Colombia is South America’s most humid major city, with 365 days of humidity, of which 248.91 are extreme. The city has plans to construct six embankments and four breakwaters to defend against the onslaught of climate change. Researchers at the Niels Bohr Institute predict that the median sea level will rise by one meter over the next 100 years, which will affect 93% of Cartagena’s tourism zone, according to the Center for Caribbean Oceanographic Research.

The most humid cities in Oceania

We also uncovered the top 10 most humid places across Oceania, based on the number of uncomfortably humid days they experience yearly.

The bulk of Oceania’s most humid major cities are in Australia, partly because this is where the majority of the region’s major cities are. However, the Fijian capital, Suva, stands out as the most humid by far, with 356.6 uncomfortably humid days per year.

09 Humid cities Oceania

Fiji’s position puts it on the front line of climate change. “[M]any children in the region have already experienced firsthand the impacts of severe cyclonic events which are happening with greater frequency,” says Milika Sobey, Pacific Islands program manager at The Asia Foundation. “They are experiencing firsthand the warmer ocean, the sea level rise, the destructive storm surges, the eroding coastlines and the trauma of relocation.”

The most humid cities in Africa

Libreville in Gabon tops the list of the 10 most humid places across Africa, according to the number of uncomfortably humid days they experience annually.

The most humid major African cities barely get a day without uncomfortable humidity each year; all among the top 20 most humid have more than 361 days per year of humidity. Cities from eight different countries are among the top ten, with diverse conditions contributing to local humidity, including proximity to the sea or dense forest cover and a tropical climate induced by closeness to the equator.

10 Humid cities Africa

Libreville, the capital of Gabon, is the only city where the dew point is always at least 16°C. Gabon is mainly covered by forests and is considered “probably the most carbon-positive country in the world due to its strong environmental conservation and longstanding political commitment to preserving the country’s untouched natural environment.” However, weather patterns are already changing drastically in Gabon, and an increase in heat waves and coastal flooding is likely to impact the country’s biodiversity and the health of locals in cities and rural areas.

The effects of high humidity on our health

In addition to feeling muggy and uncomfortable, high humidity levels can have several effects on human health. This is particularly the case for older people, those with pre-existing conditions and those who are on medication — although young, healthy people are also vulnerable to severe, ongoing humidity.

The effects of dangerous levels of humidity include:

Difficulty regulating body temperature: Humidity can slow the evaporation of sweat so that the body fails to cool — which can lead to heat stroke.
Skin issues: Trapped sweat can cause heat rash and worsen existing conditions such as eczema.
Breathing problems: Increased moisture in the air can cause the body’s airways to tighten, worsening the symptoms of asthma and other respiratory issues.
Aggravation of heart issues: Humidity increases blood flow to the skin, putting additional strain on the heart and circulatory system. Pre-existing damage from a heart attack can make it harder for your heart to keep up with demands.
Tip

To learn more about the effects of humidity on our health and our homes, check out our guide on how uncomfortable you’ll feel at different levels of humidity.

How to stay safe in high humidity

These are the best steps you can take to protect your family’s health if you’re planning on visiting any of the destinations highlighted in our study:

  1. Check the weather before you go: If the weather report suggests high humidity levels, plan to take it easy and not venture too far from well-air-conditioned areas.
  2. Dress to stay cool: Wear loose clothes to stay comfortable and a hat to keep the sun off your head and face. Light, breathable fabrics in pale, reflective colors will help your body stay cool.
  3. Drink plenty of fluids: “Drinking enough fluids is one of the most important things you can do to prevent heat illness,” according to the Centers for Disease Control and Prevention  (CDC). The CDC recommends drinking water before, during and after activity.
  4. Be aware of the symptoms: Sweating, cramps, dizziness, an itchy rash, nausea and headaches can all be symptoms of heat or humidity-induced sickness.

Sadly, humidity is an issue that is going to get worse in cities all around the world, particularly in parts of South Asia and the Persian Gulf and states including Arkansas, Missouri and Iowa.

While the sick, the elderly, and those who work most outdoors are among the most vulnerable to humidity, those “without access to air conditioning” are also vulnerable, according to NASA. “Air conditioning removes humidity from the air and is the best solution when wet-bulb temperatures get too high. Fans can help sweat evaporate more efficiently, but they’re less effective.”

Final thoughts from our founder

“Humidity in the home can cause problems ranging from discomfort to serious health issues and from moldy walls to severe structural issues. Here are some ideas on how to counter it:

1. Use a dehumidifier. Dehumidifiers pull moisture out of the air and collect it in a tank. Choose an energy-efficient one, and you’ll find it uses far less energy than many other household appliances.

2. Use electric fans. An electric fan creates a breeze to keep you cool but also prevents moisture from settling and improves evaporation levels.

3. Open doors and windows. The simplest solution to keep air flowing through your home and let moisture escape is to give it somewhere to go. If keeping external doors and windows open isn’t possible, keeping interior ones open can still help.

4. Take shorter showers and dry laundry outdoors. Consider ways that your daily routine may contribute to humidity in the home, and take steps to reduce the amount of warm moisture that you create indoors.

5. Get dehumidifying houseplants. Plants such as Baby Rubberplant, Golden Pothos and Aloe Vera are excellent at removing moisture from the air in a room.

For more tips, check out our extensive guide with advice to help you naturally dehumidify a room without a dehumidifier.”

Danny Ashton HouseFresh
Danny Ashton
Founder of HouseFresh

METHODOLOGY

To identify the cities worldwide with the most humid days annually, we pulled humidity comfort data from 14,657 major cities from https://weatherspark.com/.

Our study ranks cities based on the number of days each in 2023 with a dew point of 16°C (60°F) or above (the dew point at which the air stops feeling comfortable and starts feeling humid).

For cities that were tied on 365 annual humid days in the South America and Asia rankings, we separated them based on the number of days spent at an extreme level of humidity (24°C/75°F dew point or above).

For the U.S. map, we lowered the threshold to 10k population cities to dive deeper into the most humid cities by state beyond just the largest settlements.

The dew point defines humidity comfort levels. Dew point temperature determines when perspiration evaporates from the skin, cooling the body. Lower dew point temperatures feel drier, and higher dew points feel more humid.

Dew point better represents how humid a city feels than relative humidity. This is explained here and here.